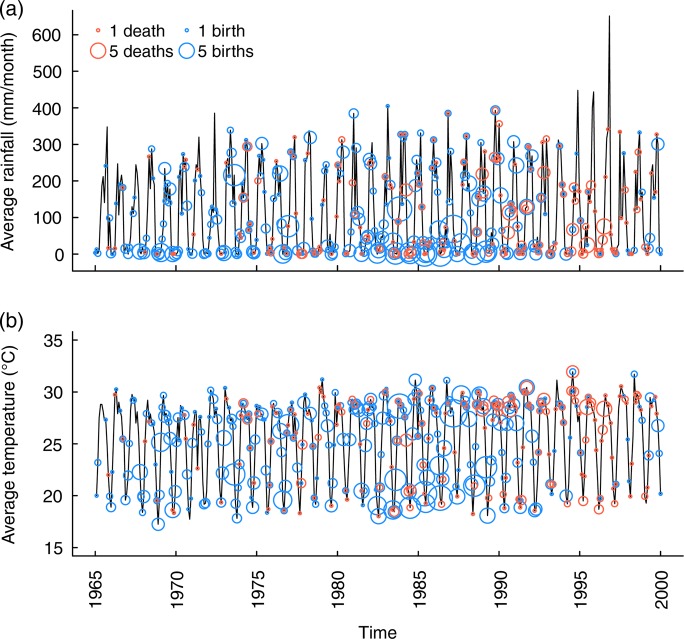
Figure 1:
Consistent annual seasonality of climate, births and deaths over 35 years in Myanmar elephants in the years 1965–2000. Climate is displayed as black curves showing rainfall (in millimetres per month; (a) and temperature (as mean monthly temperature; (b). The circles show the timing of births in blue (n = 1024) and deaths in red (n = 315), with the diameter of the circles proportional to the number of events in each month. A total of 176 100 elephant-month observations are included.

