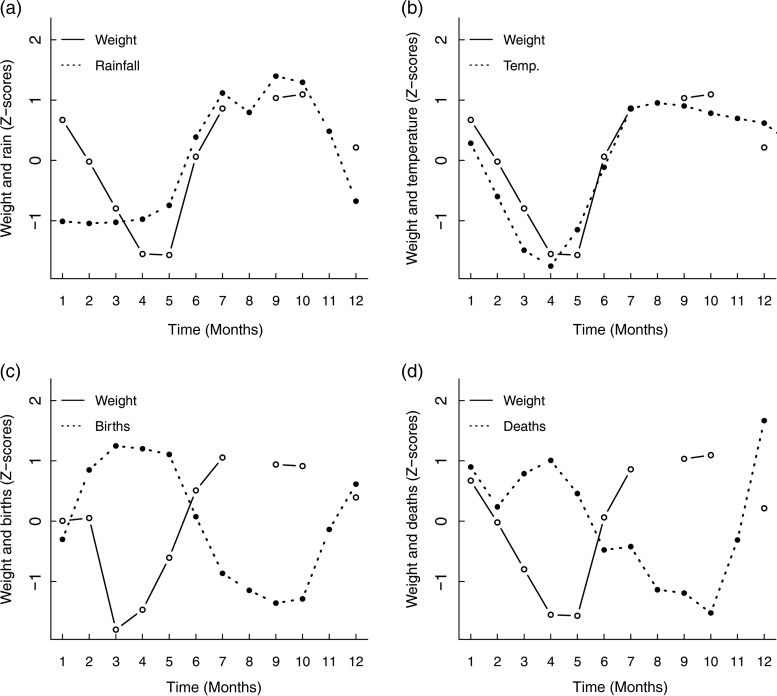
Figure 4:
Cross-correlations between body weight and total monthly rainfall with a time lag of 1 month (a), average monthly temperature with a time lag of 2 months (b), number of births 2 months previously (c) and number of deaths with a time lag of 1 month (d) in a population of Myanmar elephants. Weight values for (a), (b) and (d) are mean values for the whole population, controlling for age and sex. Weight values for (c) are for adult females (aged >16 years). Values are expressed as Z-scores.

