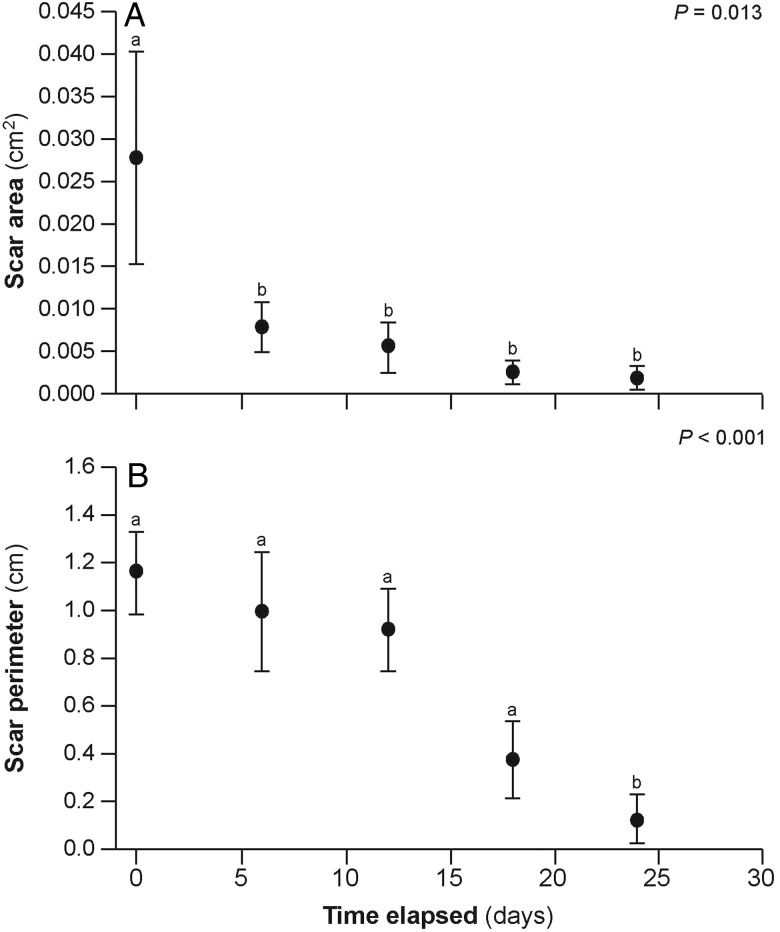
Figure 2:
Temporal evolution of umbilical scar healing rate for both significant variables, scar area (A) and scar perimeter (B). See Table 1 for further details. Different letters demarcate statistically significant differences, and P-values are indicated in the top corner of each panel.

