Figure 3:
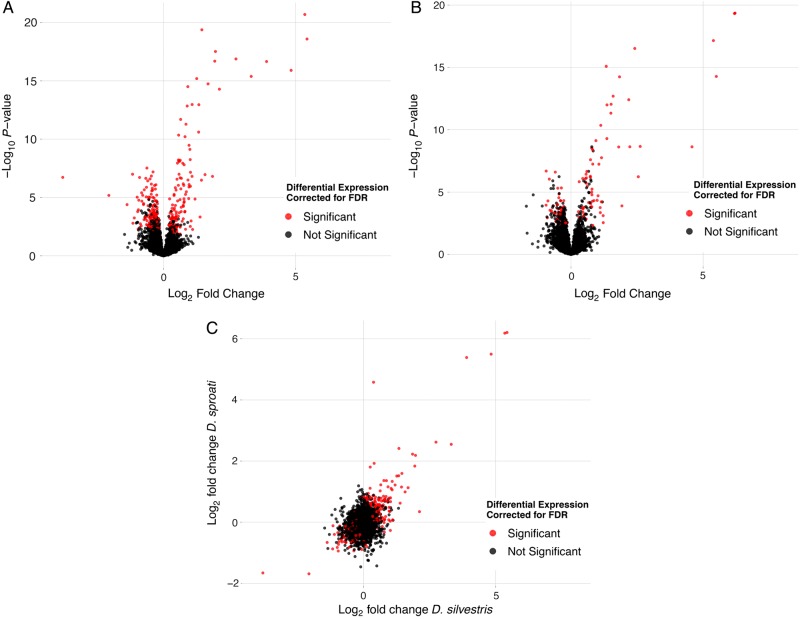
Volcano plots from microarray gene expression analysis for D. silvestris males (A) and D. sproati males (B). The x-axes on the volcano plots are the log2 fold-change of the differences in gene expression for flies exposed to 25°C for 1 h compared with control flies exposed to normal temperature for these species at 16°C for 1 h. The y-axes show the negative of the log10 corrected P-values (Benjamini and Hochberg, 1995) of the comparison of the two treatments for the same microarray probe. (C) Scatterplot of the correlation between the log2 fold-change in gene expression between heat-treated (25°C) and control (16°C) D. silvestris and D. sproati males.

