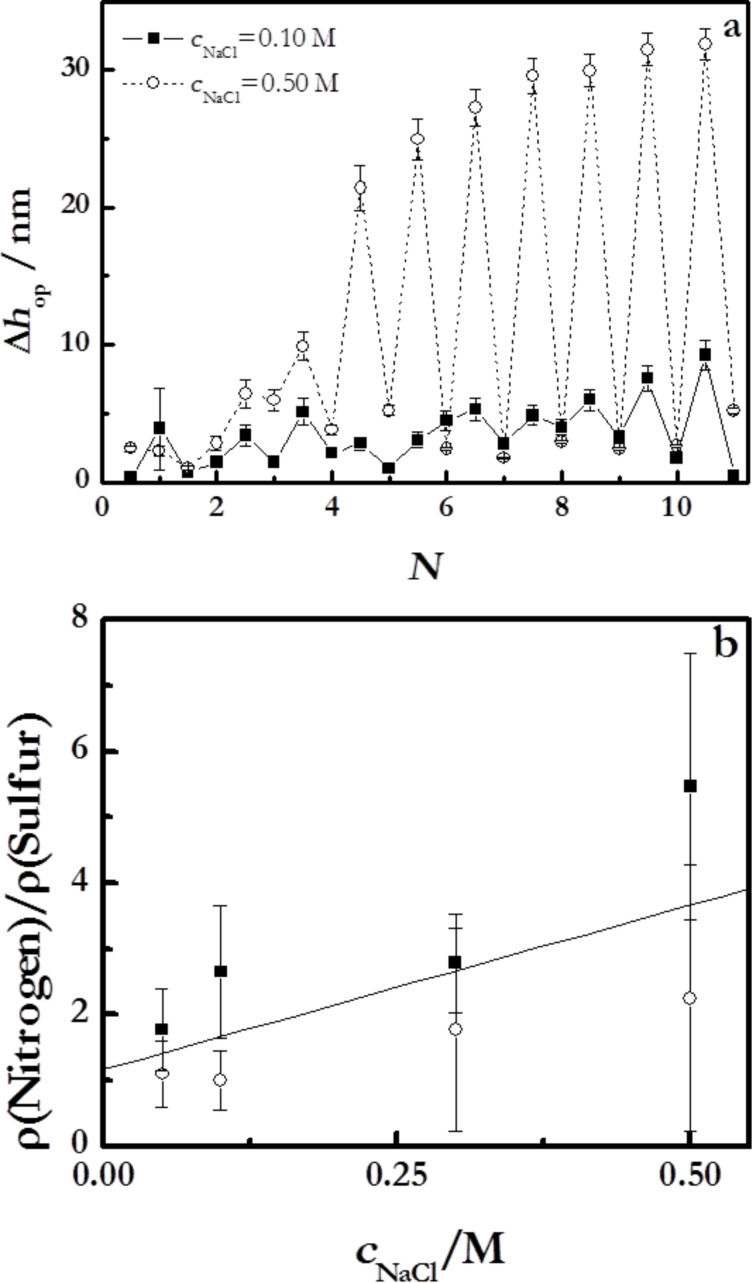
Figure 6.
(a) Variation of thickness, obtained using ellipsometry for the adsorption of single layers, as a function of N for (PDADMAC + PSS)N films formed at two different ionic strengths: 0.10 M and 0.50 M. (b) Dependence on the salt concentration of the ratio between nitrogen and sulfur contents in (PDADMAC + PSS)N films obtained from ellipsometry (solid squares) measurements average over 12 bilayers and by XPS (open circles) measurements at 0°. The solid line is to guide the eye.

