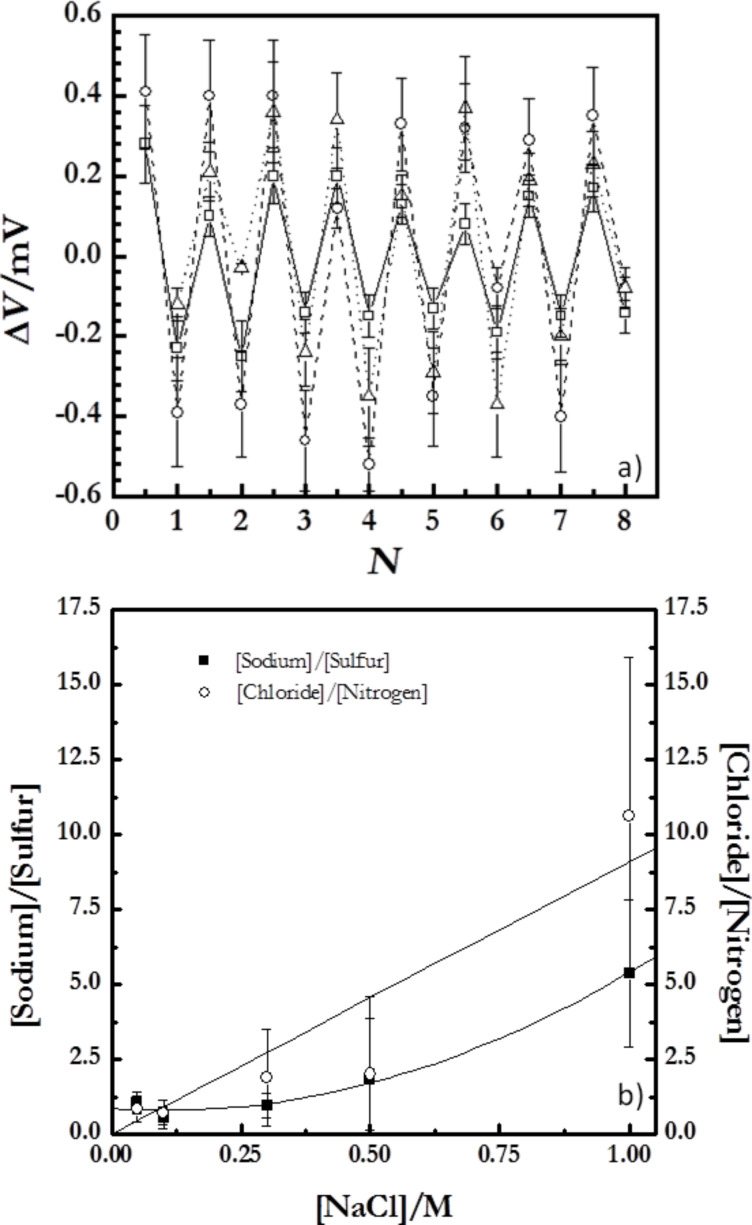
Figure 8.
(a) Changes in the surface potential, ΔV, as a function of N for (PDADMAC + PSS)N films formed at different ionic strengths. The different symbols represent different ionic strengths: (open squares) 0 M, (open circles) 0.05 M, (open triangles) 1.00 M. (b) Ratios of [sodium]/[sulfur] and [chloride]/[nitrogen] as a function of the ionic strength obtained for dry multilayers from XPS spectra. The lines are to guide the eye.

