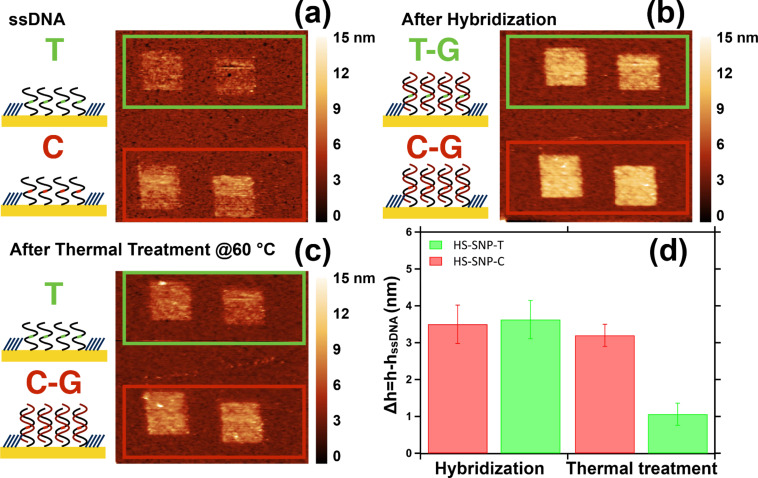
Figure 2.
Schematic view and AFM topographic images of HS-SNP-C and HS-SNP-T nanografted patches (a) before and (b) after incubation with SNP-C for 1 h and (c) thermal treatment. (d) Histogram of the height variation with respect to the ssDNA patches (Δh = h − hssDNA) after the hybridization with SNP-C-Co sequence and after the thermal treatment (1 h at 60 °C).

