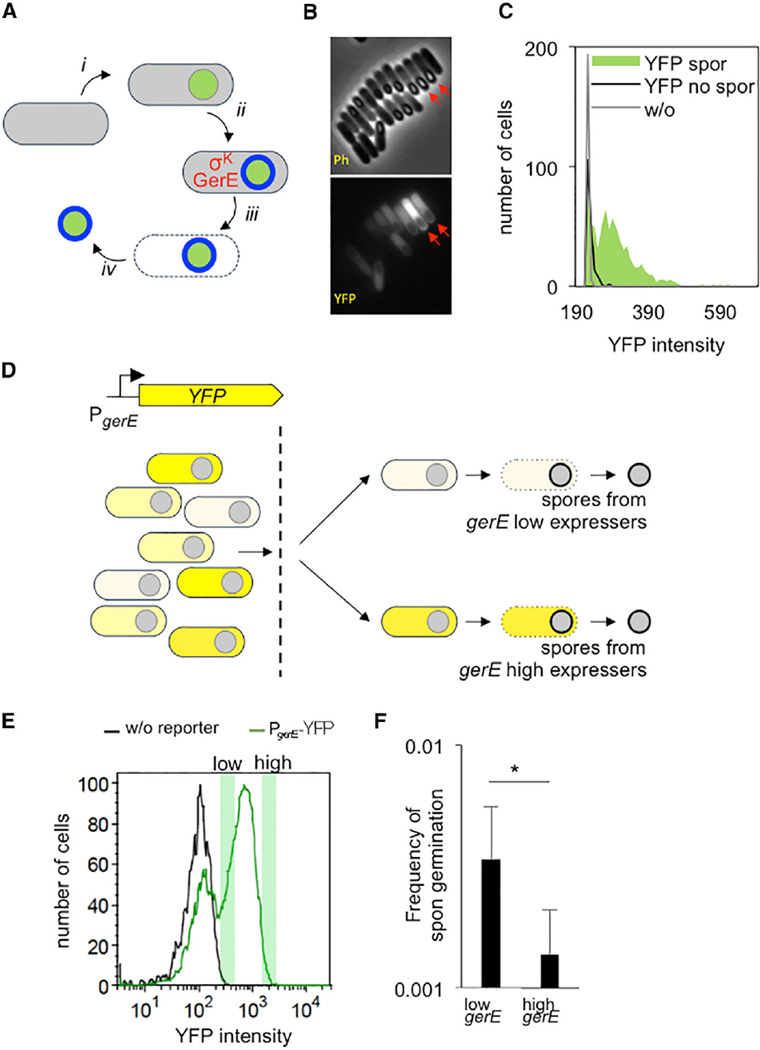
Figure 2. Phenotypic Variation in Spontaneous Germination.
(A) In sporulating cells, the forespore (green) becomes engulfed within the mother cell (gray) (i); the transcription factors σK and GerE act in the mother cell and together control the expression of genes encoding proteins of the spore coat (blue) (ii); lysis of the mother cell (iii) results in release of the mature spore into the environment (iv).
(B) A PgerE-YFP strain was sporulated by re-suspension, and fluorescence was monitored at 5 hr following initiation of sporulation (Ph, phase; YFP, fluorescence). Note the variation in the total cellular fluorescence of individual cells that appeared to be at a similar stage in spore formation (red arrows).
(C) Quantification of (B). The YFP intensity of ~725 sporulating cells (“YFP spor,” green area), ~175 non-sporulating cells (“YFP no spor,” black line), and~200 cells lacking the reporter (“w/o,” gray line) was measured.
(D) Sporulating PgerE-YFP cells are separated into populations expressing either high levels or low levels of YFP. These populations are then allowed to complete sporulation separately.
(E) Cells analyzed by fluorescence-activated cell sorting (FACS) at hour 5 following initiation of sporulation by re-suspension exhibited a bimodal fluorescence distribution. Fractions taken from the right green peak (green shaded boxes) associated with “high YFP” (intensity between 1 × 10³ and 2 × 10³ a.u.) and “low YFP” (intensity between 275 and 450 a.u.) were identified and separated. The left green peak represents non-PgerE-YFP-expressing cells since they overlap with the fluorescence of cells of a strain that lacked the PgerE-YFP reporter (black) and are predominantly non-sporulating cells as visualized by microscopy.
(F) Spores that originated from distinct fractions deriving from either high or low gerE-expressing cells that were identified in (E) were plated on mISP4 and LB. The ratio of CFUs (“Frequency of spontaneous germination”) was determined; asterisk (*) denotes that p = 0.03 (Mann Whitney test). Shown is the mean, and error bars represent the SD.

