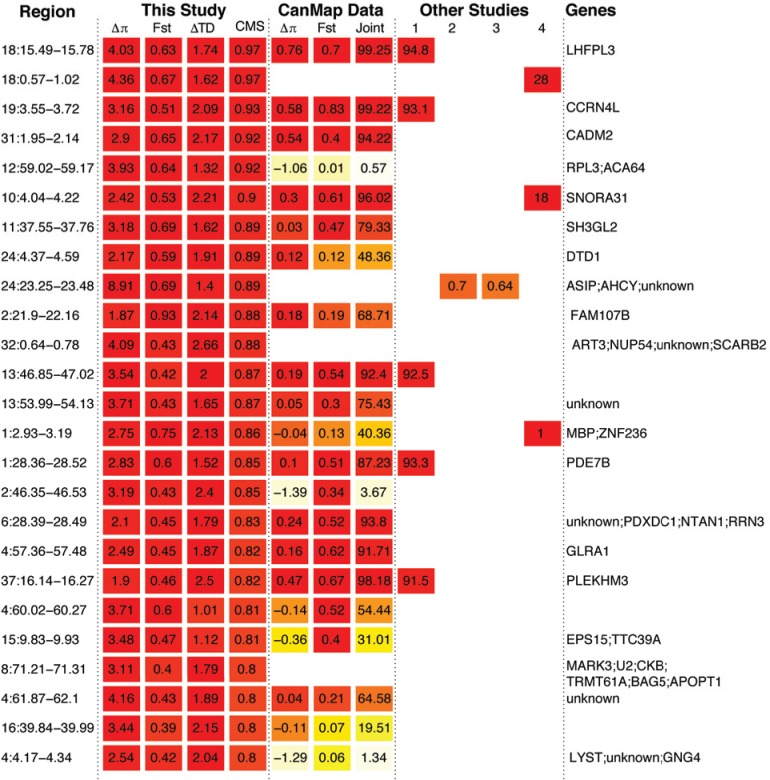
Fig 5. Top 25 outlier regions identified using the FDR-based methodology using Δout FST, Δ Tajima’s D and validated with the 12-breed dog diversity panel (see text), with regions ranked according their respective maximum CMS1-FDR statistic.
Columns within “This study” are based on the sequencing data generated here, while those under “CanMap” are computed from a ~48k SNP data set for a large set of wolves and ancient/basal dog breeds [35]. Heat map colors reflect upper percentiles of the calculated metrics, with warmer colors indicating higher percentiles. Overlaps with previous studies: 1, vonHoldt et al. 2010 [35]; 2, Vaysse et al. (2011) [25]; 3, Boyko et al. (2010) [23]; and Axelsson et al. (2013), [27]; with numbers indicating the joint percentile, FST, FST and region id, respectively for each study.

