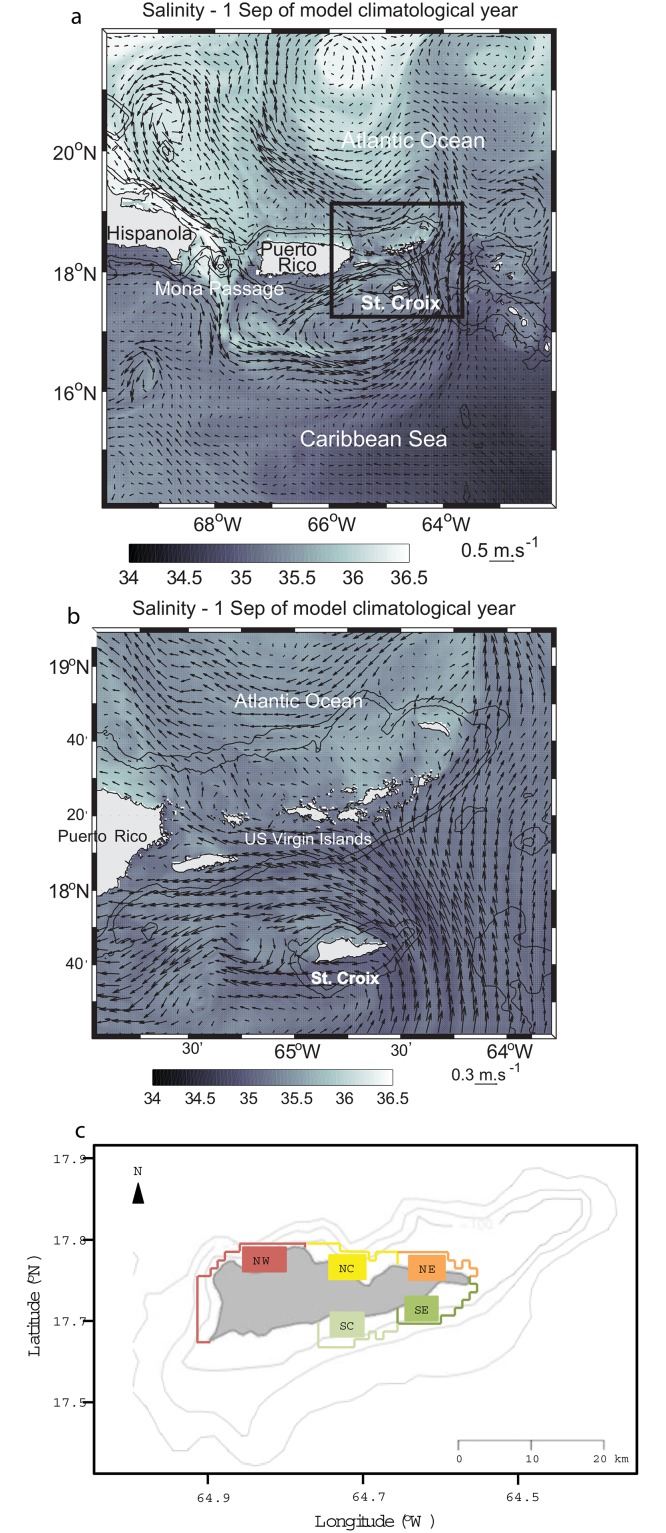
Fig 1. Snapshot of the flow field vectors overlaid on salinity in two of the model grids.
(a) Parent grid, which encompasses the northeastern Caribbean Sea. The black square shows the contour of the first child grid. (b) First child grid. (c) Habitat polygons corresponding to both virtual release and recruitment areas around St. Croix.

