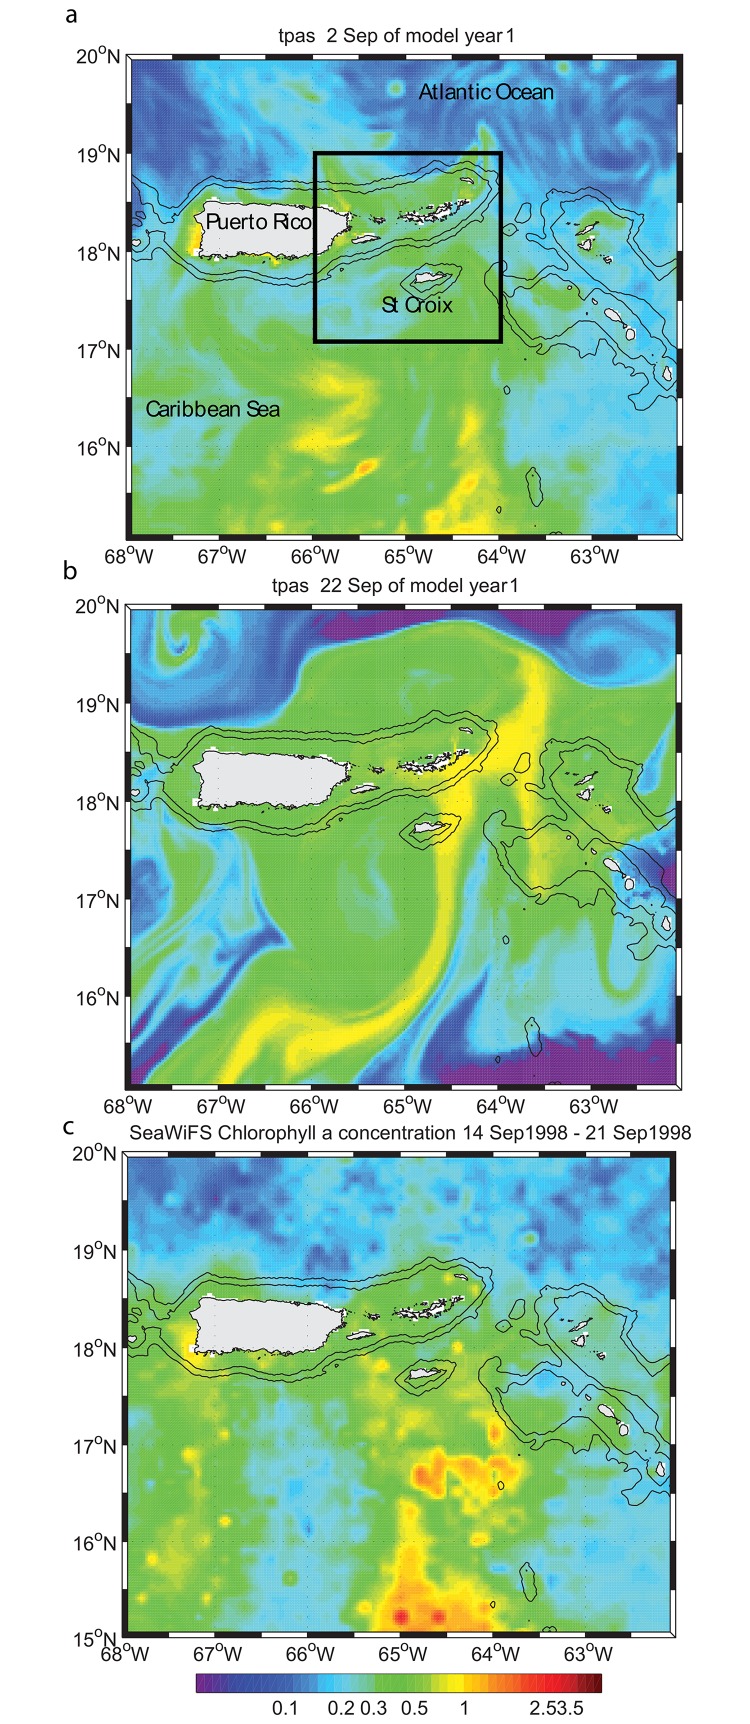
Fig 3. Chlorophyll a concentration in model parent grid in mg.m-3.
(a) Model initial field obtained from SeaWiFS chlorophyll a concentration 8-day average using the time period 29 September 2000–06 October 2000. Black square shows the boundary of the first child grid. (b) Model field twenty-two days after initialization. (c) same as (a) for the time period 14–21 September 1998.

