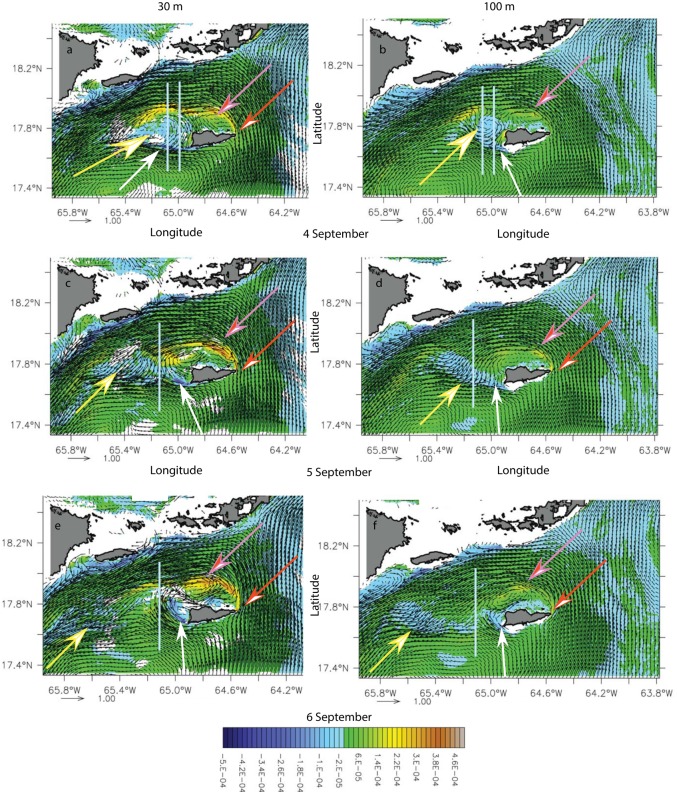
Fig 5. Potential vorticity anomaly (PVA) (s-1) time series at 30-m (left column) and 100-m (right column) during the cyclonic wake-flow period in model month September of the climatological simulation, for model day 4 (a, b), 5 (c, d) and 6 (e, f).
White (orange) arrows show the negative (positive) vorticity anomaly generation region. Yellow (pink) arrows indicate the anticyclone (cyclone). Grey lines show the location of the cross sections in Fig 6.

