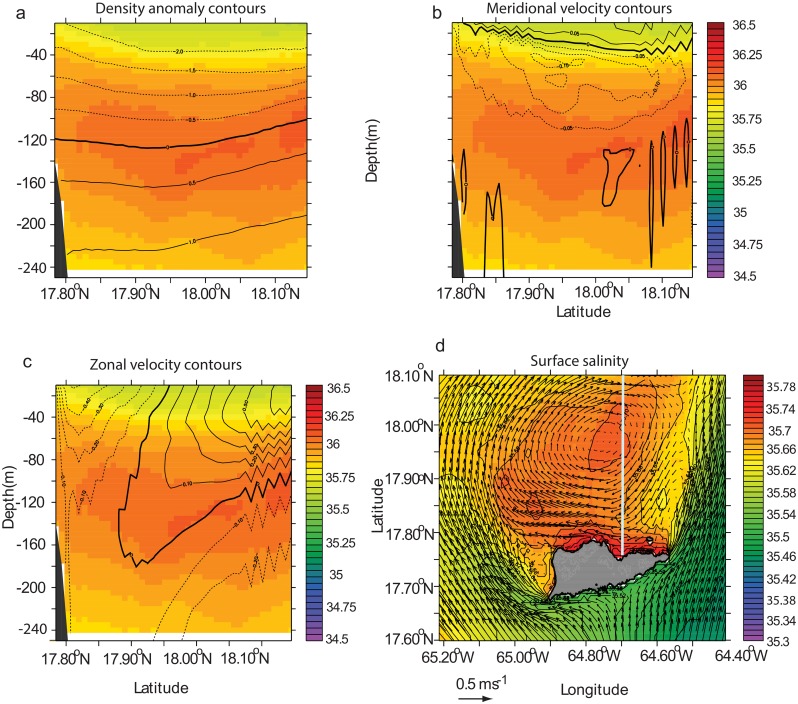
Fig 8. Mean salinity of the north side of St. Croix during model month 1–20 August 2007 of the real time simulation.
(a) salinity meridional cross section at 64.7°N overlaid with density anomaly contours. Thick line shows 0 contour. Contour interval is 0.5. Dash (solid) lines show negative (positive) anomalies. The reference density is 1025 kg.m-3. (b) Same cross section as (a) overlaid with meridional velocity contours. Velocity increment is 0.05 m.s-1. (c) Same cross section as (a) with zonal velocity contours. Velocity increment is 0.1 m.s-1. (d) Mean horizontal surface salinity field (color) overlaid with mean velocity vectors. The grey line shows the location of the cross section.

