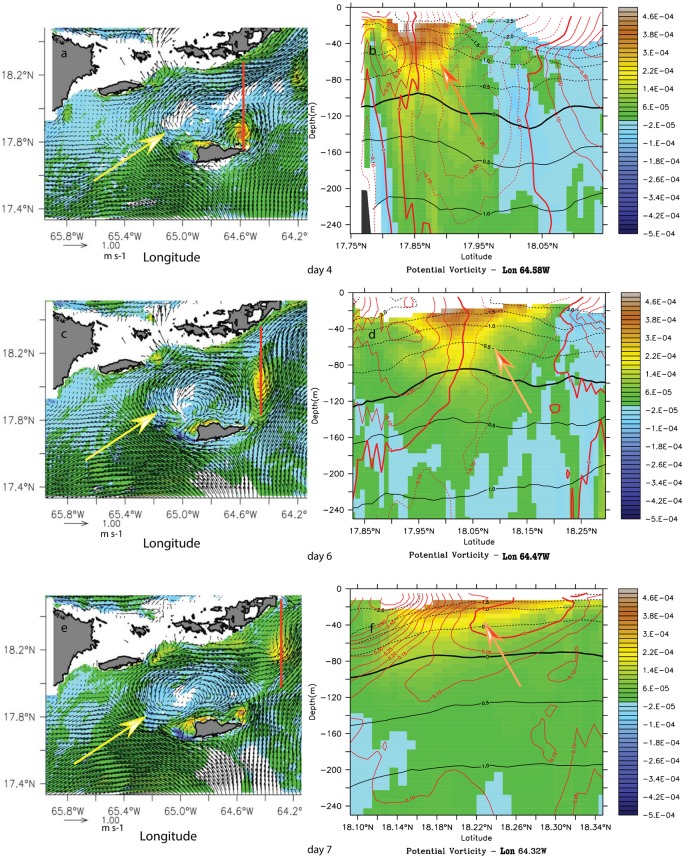
Fig 9. Potential vorticity anomaly (PVA) (s-1) snapshot at 30-m (left column) and meridional cross-section (right column) during the anticyclonic wake flow in August of model year 2007.
(a) PVA on 4 August. (b) PVA meridional section in the cyclonic eddy at 64.58°W. (c) PVA on 6 August. (d) PVA meridional section in the cyclonic vorticity core at 64.47°W. (e) PVA on 7 August. (b) PVA meridional section in the cyclonic vorticity core at 64.32°W. Yellow arrows show the anticyclone and the red line shows the cross-section location across the cyclone. The orange arrow in the right panels shows the cyclonic vorticity.

