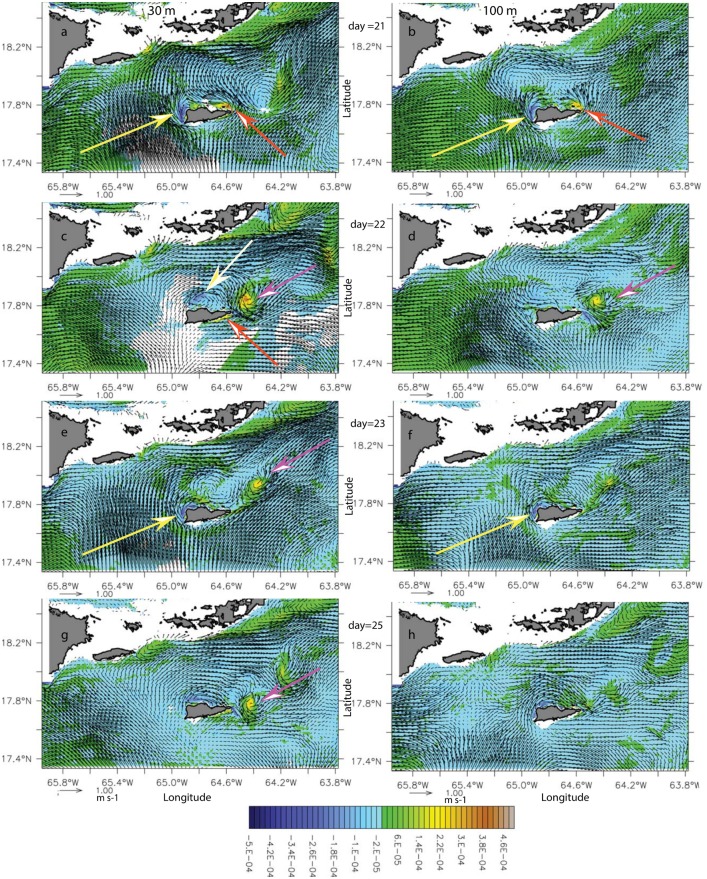
Fig 10. Potential vorticity anomaly (PVA) (s-1) time series at 30-m (left column) and 100-m (right column) during the eastern cyclones shedding wake-flow period in model month August 2007.
From top to bottom, model day 21(a, b), 22(c, d), 23(e, f), and 25(g, h). Yellow (orange) arrows show the negative (positive) vorticity anomaly generation regions. White (pink) arrows show the anticyclone (cyclone).

