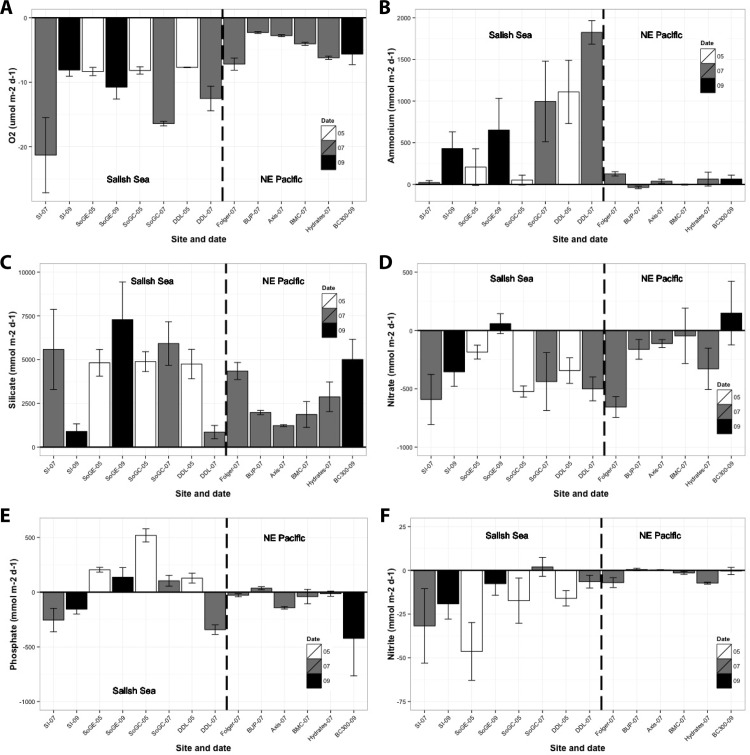
Fig 2.
Benthic fluxes (±SE) of a) oxygen, b) ammonium, c) silicate, d) nitrate, e) phosphate and f) nitrite measured at each location. Oxygen uptake is reported in mmol m-2 d-1 whereas other fluxes units are reported in μmol m-2 d-1. White bars represent fluxes measured in May 2011, grey bars represent fluxes measured in July 2011, and black bars represent fluxes measured in September 2013. Horizontal lines indicate sediment–water interface where fluxes above the lines represent sediment release and fluxes below the lines represent sediment uptake. Vertical dashed lines separate Salish Sea (left) and NE Pacific (right) stations.

