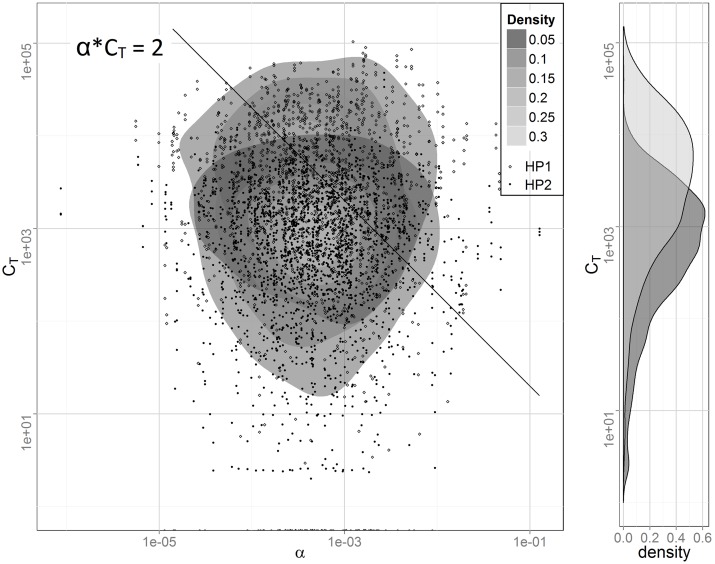
Fig 1. The bivariate distribution of the susceptibility parameter α and cumulative cercarial exposure CT together with the marginal distribution of CT for simulated populations HP1 (light) and HP2 (dark).
In both populations the distribution of α is log normal with a geometric standard deviation of 4.5. αCT = 2 is the lower bound on the number of worms necessary to produce schistosome eggs.

