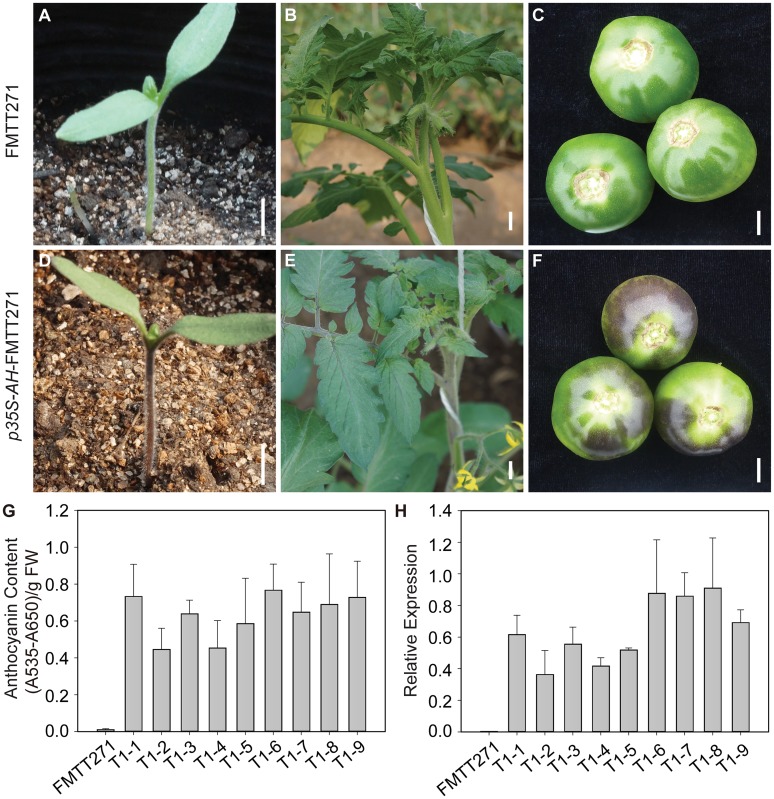
Fig 2. Analyses of AH expression and anthocyanin content in leaves of control and AH over-expressing transgenic tomato lines.
(A-F) Phenotypes of hypocotyls, leaves and fruits of the control and AH-expressing lines. Scale bars, 1 cm. (G) Total anthocyanin content in leaves of the control and AH-expressing lines (T1-1 to T1-9). (H) Relative expression levels of AH in leaves of the control and AH-expressing lines (T1-1 to T1-9). T1 generation plants were used for the analyses. Data presented here are the means of three replicates with error bars indicating ±SD.

