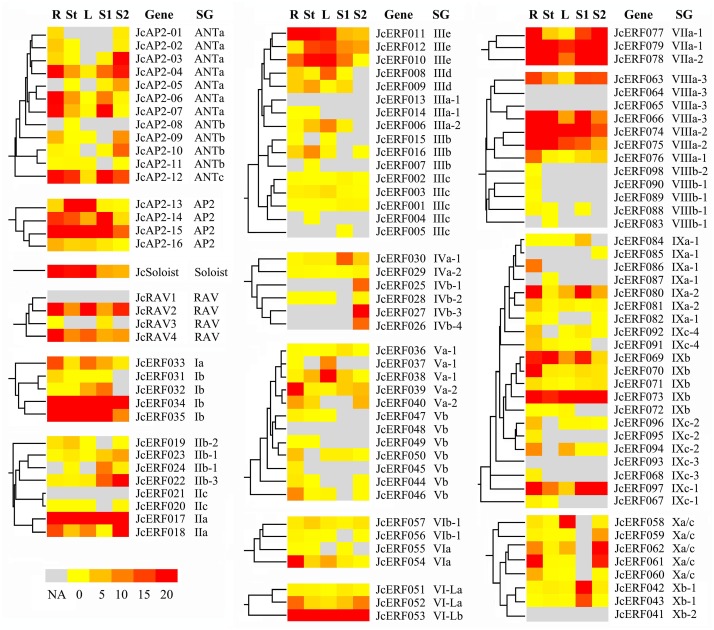
Fig 4. Relative levels of expression of JcAP2/ERF genes, divided into different subgroups.
Relative expression level of each JcAP2/ERF gene in roots (R) and stem cortex (St) and leaves (L) (sampled from six- to ten- leaf physic nut plants) is the average value from 6 biological repeats of digital expression profile tag analysis [44]. Relative expression level of each JcAP2/ERF gene in seeds is the average value of 3 points of early development stage (S1) and 4 points of filling and maturation stage (S2) [55]. SG, subgroup; NA, not available.

