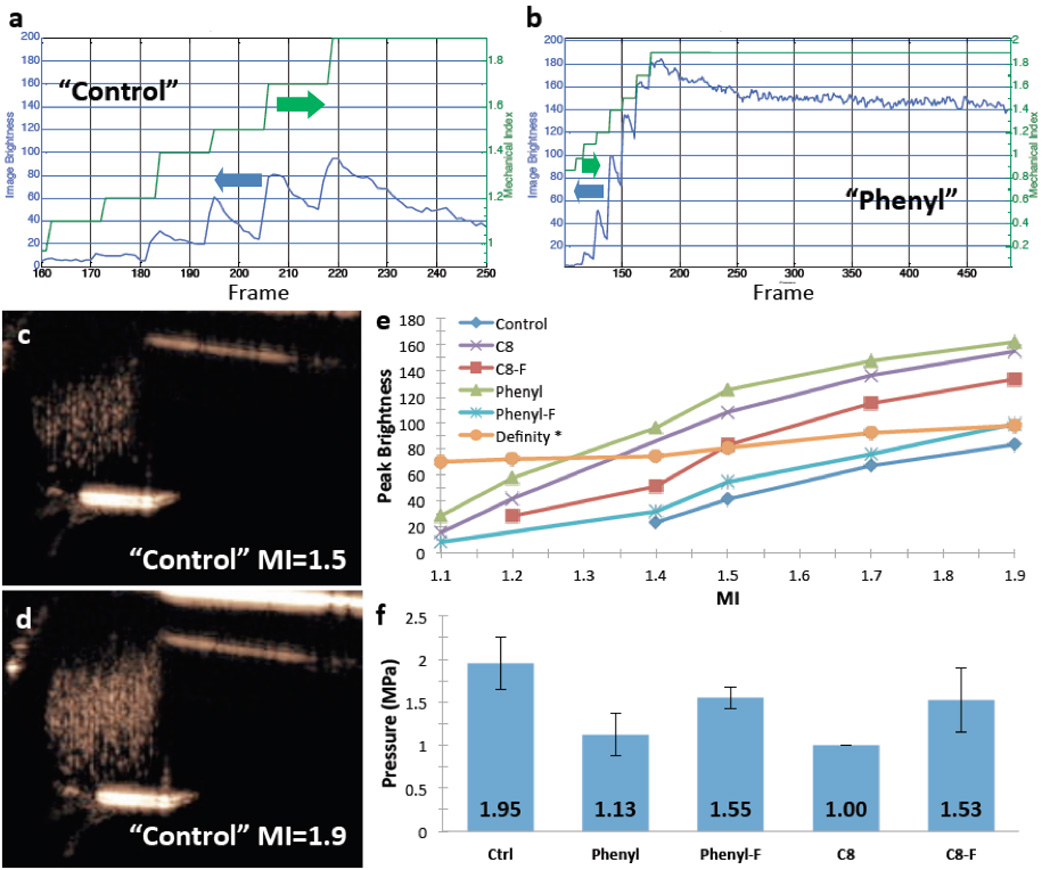
Figure 4. Image brightness over time with CPS imaging as a function of MI of PFP gas filled nanoshells.

A) Signal brightness plotted with mechanical index as a function of time (frames) for control nanoshells. B) Signal brightness and mechanical index as a function of time (frames) for phenyl nanoshells. Note that with each MI step, brightness increases and then decays until the next MI step. Also note the greater signal generated with the Phenyl formulation at each MI and the slower decay even at maximum MI of 1.9. C) CPS image of control nanoshells acquired at MI = 1.5 D) CPS image of control nanoshells acquired at MI = 1.9. Note the greater brightness at 1.9 MI. E) is a plot of peak brightness on CPS images as a function of MI for all formulations. Note that the Phenyl formulation had a relatively low threshold and generated the brightest signal at all MIs. *Note: The sample gas volumes occupied between the nanoshells and Definity™ are equal; however; the Definity™ particle count is 64 times less than the nanoshells due to their larger size. F) Pressure threshold of the HIFU pulse that generated signal on the CPS image. Error bars signify standard deviations, N = 5. Individual plots with standard deviations can be seen in supplemental Figure 1. It should be noted that the brightness is log compressed.
