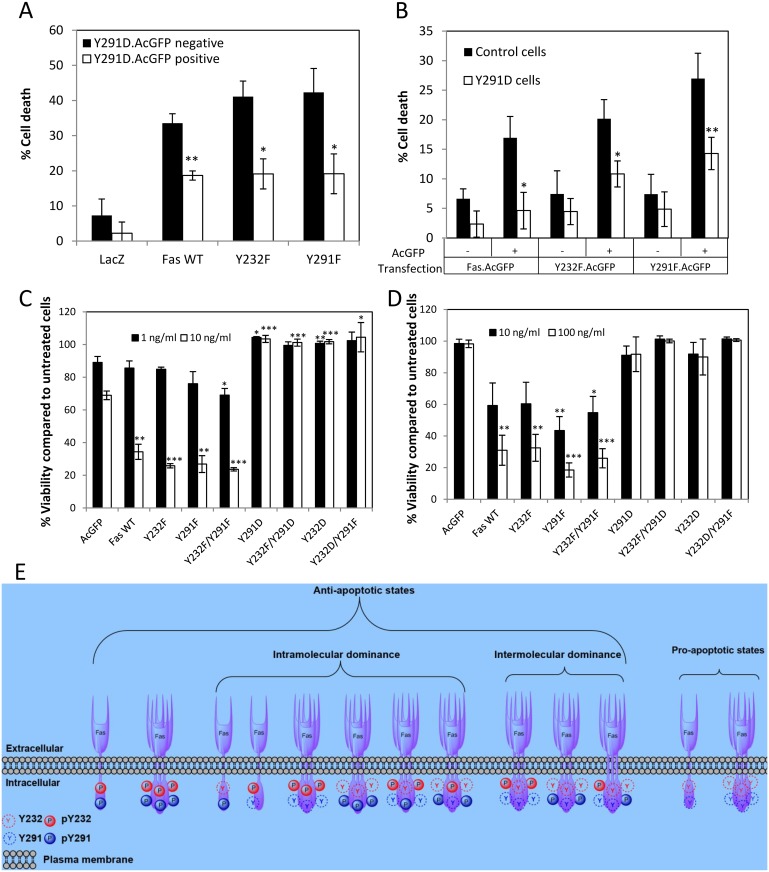
Fig 3. Introduction of negative charge to the 291 position results in a dominant inter- and intra-molecular anti-apoptotic capacity to Fas.
(A) SW480 cells stably expressing V5-tagged LacZ and “dead-on” Fas proteins (wild-type, Y232F, or Y291F) were transiently transfected with AcGFP-tagged Y291D Fas for 24 h and subsequently treated with 8 ng/ml FasL+M2 or left untreated for 4 h. Cells were then stained with propidium iodide (PI) and analyzed by flow cytometry for cell death based on membrane permeability. The percentages of PI-positive cells (dead cells) due to FasL treatment in the Y291D.AcGFP-positive and Y291D.AcGFP-negative cell populations are compared after subtracting the percentage of spontaneous cell death in untreated cells. Note an increased resistance to FasL-induced cell death when Y291D.AcGFP Fas was introduced in cells that stably expressed “dead-on” Fas. Values represent means ± SEM from three independent experiments (* p < 0.05, ** p < 0.01, unpaired t test, compared to Y291D.AcGFP negative cells). (B) SW480 cells stably expressing V5-tagged LacZ (control) and “dead-off” Fas Y291D were transiently transfected with AcGFP-tagged “dead-on” Fas (wild-type, Y232F, or Y291F) for 24 h and subsequently treated with 8 ng/ml FasL+M2 or left untreated for 4 h. Cells were then stained with PI and analyzed for cell death by flow cytometry. The percentages of PI-positive cells in the “dead-on” Fas.AcGFP-negative and -positive cell populations are compared after subtracting the percentage of spontaneous cell death in untreated cells. Values represent means ± SEM from three independent experiments (* p < 0.05, ** p < 0.01, paired t test, compared to control cells). Note that compared to control cells, cells stably expressing “dead-off” Y291D Fas were more resistant to the increase in FasL-induced cell death brought about by the introduction of “dead-on” Fas.AcGFP species. (C) SW480 and (D) SW620 cells stably expressing AcGFP or AcGFP-tagged wild-type or indicated mutant Fas proteins were left untreated or treated with indicated concentration of FasL crosslinked with M2 for 24 h and subjected to viability measurement by WST-1 assay. Cell viability is presented as percentage compared to untreated control cells. The presence of Y—>D mutations completely inhibited FasL-induced cell death. Values represent means ± SEM from three independent experiments (* p < 0.05, ** p < 0.01, *** p < 0.001, unpaired t test). (E) A diagram depicting different states of Fas, with respect to its ability to transmit an apoptotic signal, as affected by its death domain phosphorylation. Examples of possible dominant-negative scenarios are given. Numerical values underlying the data summary displayed in this figure can be found in S1 Data.

