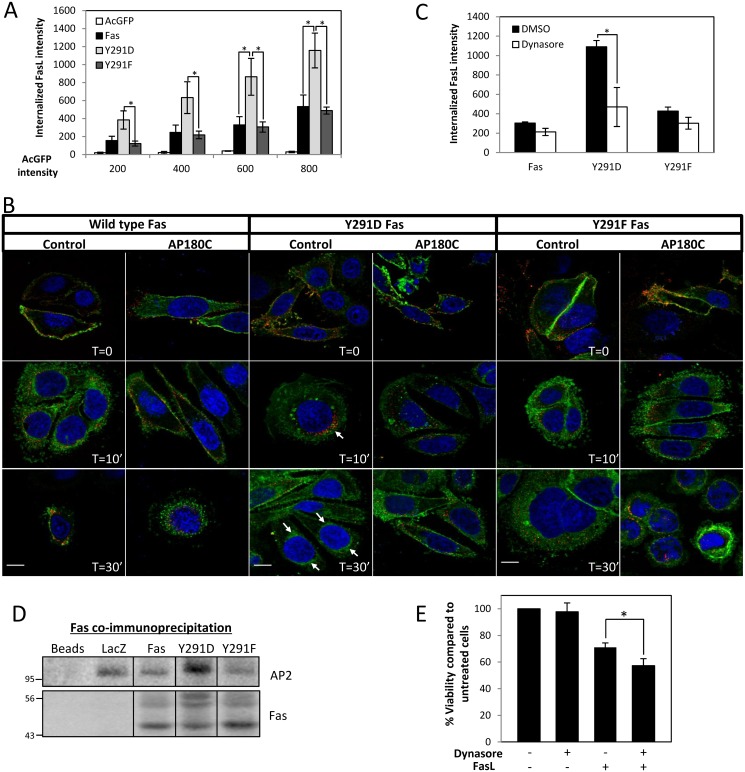
Fig 4. The negative charge of phosphorylated Y291 can promote clathrin-dependent endocytosis (CDE) of Fas upon FasL engagement.
(A) Flow cytometry analysis of internalized FasL in SW480 cells overexpressing AcGFP or AcGFP-tagged Fas proteins (as indicated). The extent of FasL internalization was evaluated in cells that expressed equivalent levels of Fas by gating based on the expression level of AcGFP. Results are presented as intensity of internalized FasL in indicated cell lines at different expression levels of AcGFP-tagged Fas or control AcGFP. Note an increase in FasL internalization in SW480 cells overexpressing Y291D.AcGFP Fas. Means ± SEM from three independent experiments are shown (* p < 0.05, unpaired t test). (B) SW480 cells overexpressing indicated AcGFP-tagged Fas proteins were transiently transfected with AP180-C or control vector before subjected to the internalization assay and imaged by a spinning disk confocal microscope. Color-combined images are presented (green, Fas.AcGFP; red, crosslinked FasL; blue nucleus, scale bar = 10 μm, arrows indicate perinuclear region). Unmerged images showing each channel separately are provided in S5 Fig. (C) SW480 cells expressing indicated AcGFP-tagged Fas proteins were pretreated with vehicle (DMSO) or 100 μM dynasore 30 min before FasL internalization assay and flow cytometry analysis. Fluorescence intensity of internalized FasL of cells with equivalent AcGFP or AcGFP-tagged Fas expression is presented (AcGFP intensity ~600). Means ± SEM are shown (* p < 0.05, paired t test). (D) Postnuclear supernatants from SW480 cells expressing V5-tagged LacZ or Fas proteins were subjected to coimmunoprecipitation with anti-Fas antibody, SDS-PAGE, and immunoblotting by indicated antibodies. Note that the low level of immunoprecipitated Fas from the LacZ sample could be visualized on the image from longer exposure. (E) SW480 cells expressing V5-tagged wild-type Fas protein pretreated with vehicle (DMSO) or 10 μM dynasore for 30 min were incubated with 10 ng/ml FasL crosslinked with M2 for 24 h before cell viability test by WST-1 assay. Percentage of viability compared to untreated control cells is shown. Means ± SEM from three independent experiments are presented (* p < 0.05, unpaired t test). Numerical values underlying the data summary displayed in this figure can be found in S1 Data.

