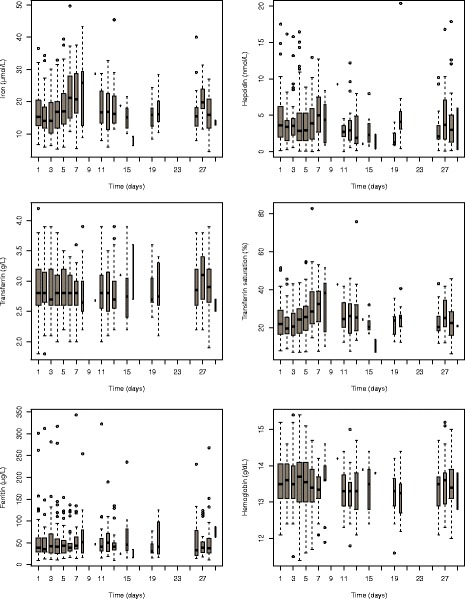
Fig. 2.

Evolution of iron-status variables during the menstrual cycle in the Hepmen study, shown as boxplots. The Y-axis for the hepcidin plot was set to 0–20, excluding seven outlying observations from the plot to better show the evolution during the cycle. The width of each box is proportional to the number of observations collected on each day
