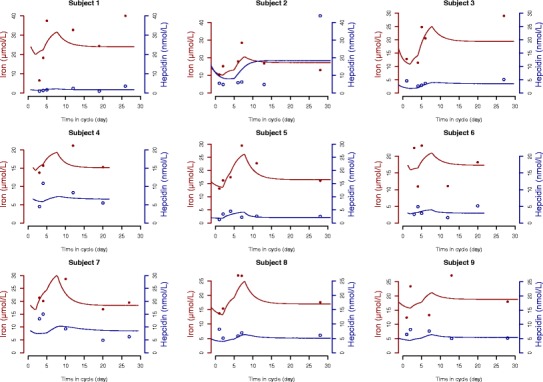
Fig. 4.

Individual fits for the first nine subjects in the dataset, for iron (red, closed symbols) and hepcidin (blue, open circles). The symbols on the individual fits represent individual measured concentrations, and the solid lines represent model predictions
