
Fig. 5.
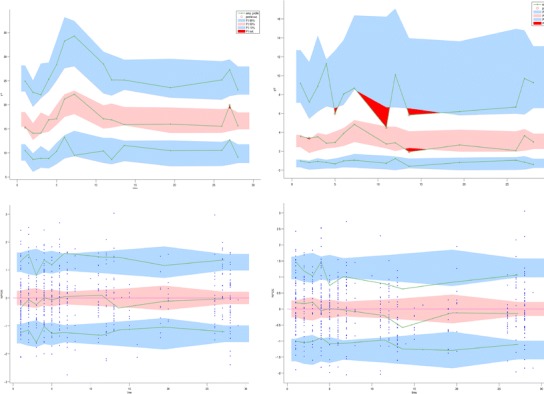
Diagnostic VPC (top) and graphs of the NPDE (bottom), as obtained with the Monolix software for iron (left) and hepcidin (right). The solid lines represent the 10th, 50th and 90th empirical percentiles of the measured concentrations in the diagnostics VPC and of empirical percentiles of the residuals in the NPDE graphs. The coloured areas represent the 90% prediction interval associated with the 10th, 50th and 90th theoretical percentile in the first case and the confidence interval in the second