
Fig. 1.
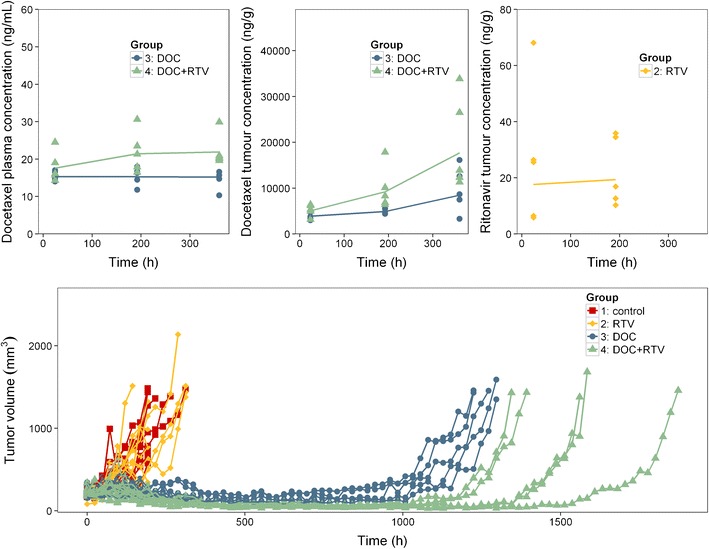
Observed pharmacokinetic and pharmacodynamic data of different study groups in mice. DOC, docetaxel; RTV, ritonavir. The upper panels show the pharmacokinetic data, the symbols represent each observed concentration level, and the line represents the mean concentration levels of each group; the lower panel presents the tumour volumes, the symbols represent each observed tumour volume, and each line represents the tumour volume of one mouse. This figure was originally published in (17). The figure is republished and modified with permission