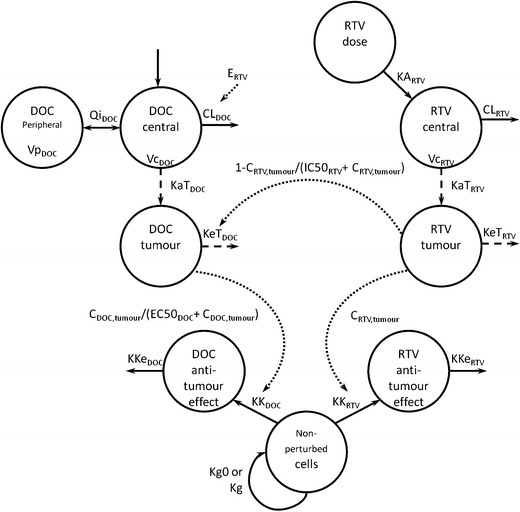
Fig. 2.

Schematic structure of pharmacokinetic-pharmacodynamic model. C, concentration; CL, clearance; DOC, docetaxel; EC50 DOC, docetaxel tumour concentration with 50% of maximum anti-cancer effect; E RTV, difference between clearance of combined treatment group and single treatment group; IC50 RTV, ritonavir tumour concentration inhibiting half of Cyp3a enzymes in tumour; KA, absorption rate in central compartment; KaT, absorption rate in tumour; KeT, elimination rate in tumour; Kg, net growth rate in treated groups; Kg0, net growth rate in untreated groups; KK, cell transition rate to effect compartment; KKe, cell elimination from effect compartment; Qi, inter-compartment clearance; RTV, ritonavir; Vc, volume of distribution of central compartment; Vp, volume distribution of peripheral compartment
