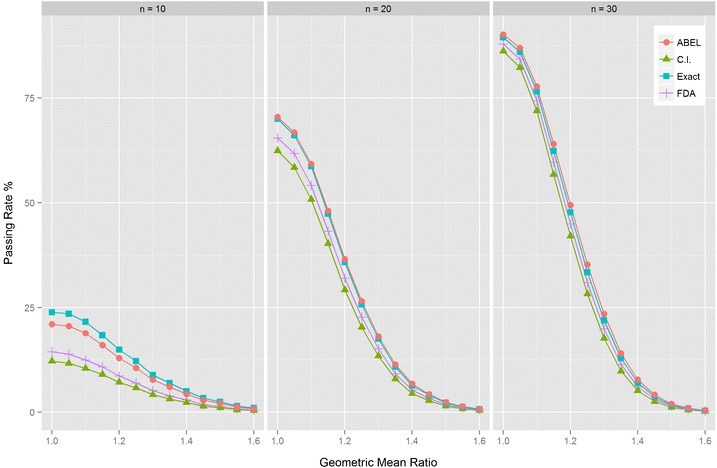
Fig. 2.

Power curves for methods assessing RSABE. The dependence of the percentage of accepted BE studies is shown at various ratios of the geometric means (GMR) of the two formulations. Parallel design was assumed. The standard deviation for both products was 0.4 which corresponds to CV = 41.65%. The regulatory constant was set to 0.89 according to the FDA requirements. Bioequivalence was evaluated with the method of Hyslop et al. (2) as recommended by the FDA (4,8), the ABEL method as recommended by the EMA (6), and the Exact approach as described in the “METHODS” section
