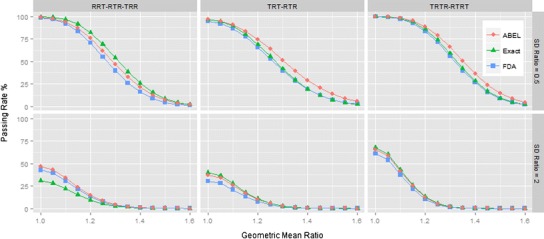
Fig. 4.

Effect of heteroscedasticity. It was assumed that the Test and Reference formulations have different within-subject standard deviations. The SD ratio is the s WT/s WR ratio. When the SD ratio was 0.5, then the simulation parameters were s WT = 0.25 and s WR = 0.5. When the SD ratio was 2, the simulation parameters were switched and s WT was 0.5 and s WR = 0.25. For other notations, see Fig. 3
