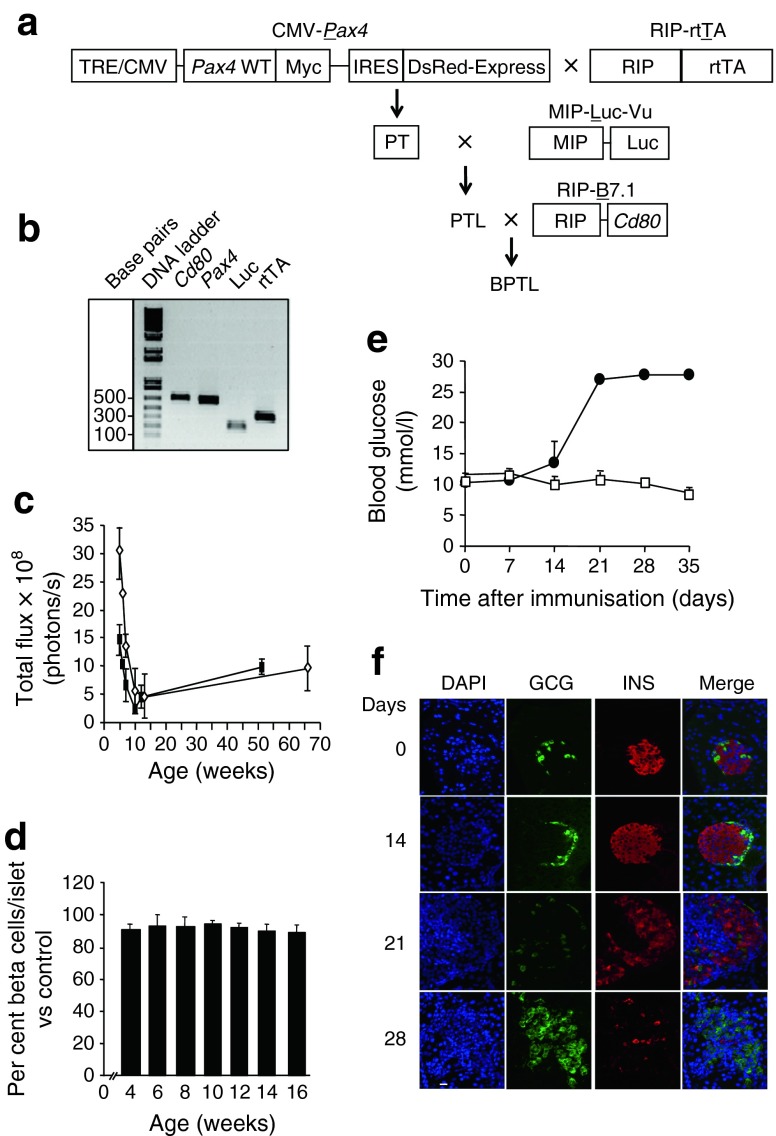
Fig. 1.
Characterisation of the BPTL mice. (a) Schematic diagram showing the generation of the BPTL mouse. (b) Genotyping of BPTL mice by PCR using primer sets for Cd80, Pax4, Luc and rtTA. (c) The bioluminescent signal was correlated with age in BPTL male (white diamonds, n = 5) and female (black rectangles, n = 5) mice. (d) BCM calculated as a percentage of total islet cells and compared with 8-week-old animals was assessed in both sexes. On average, cells from at least 25 islets were counted per animal, with each group comprising at least 5–6 mice. (e) Blood glucose levels were measured for up to 35 days in BPTL mice (n = 3) immunised (black circles) or not (control, white squares). (f) Pancreatic sections of BPTL mice at the indicated time after immunisation were co-immunostained for glucagon (green) and insulin (red). Nuclei were stained with DAPI (blue). Scale bar, 25 μm. GCG, glucagon; INS, insulin

