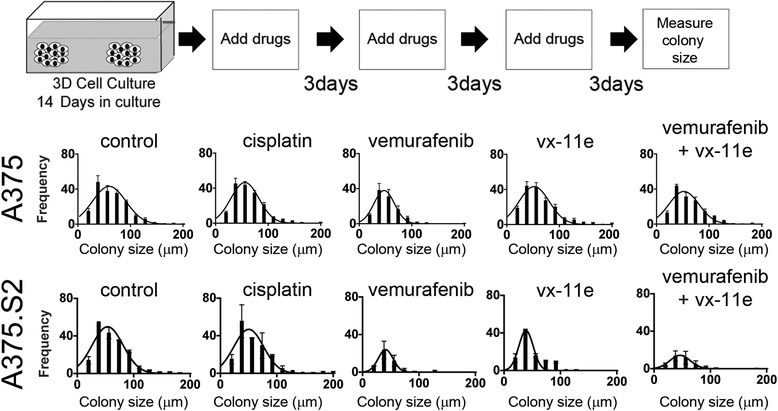
Fig. 3.

A375 and A375.S2 colonies show a differential response to drug treatment. Schematic showing the timing of drug administration for cells embedded in 3D soft agar with treatment commencing after colony formation. Growth of isogenic colonies in 3D soft-agar assays shows differential response to drug treatment. A375 colonies (Top panel) are largely insensitive to drug treatment, whereas A375.S2 (Bottom panel) cells form fewer colonies of smaller size as determined by diameter
