Fig. 2.

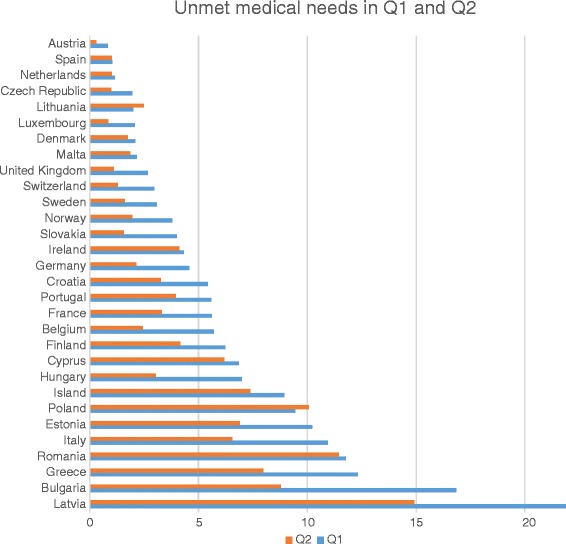
Comparing income-based unmet medical needs across quintiles, 2012 (in % of quintile). Note: EU SILC data, Q1 refers to the poorest income quintile, Q2 to the lower middle income quintile

Comparing income-based unmet medical needs across quintiles, 2012 (in % of quintile). Note: EU SILC data, Q1 refers to the poorest income quintile, Q2 to the lower middle income quintile