Fig. 2.

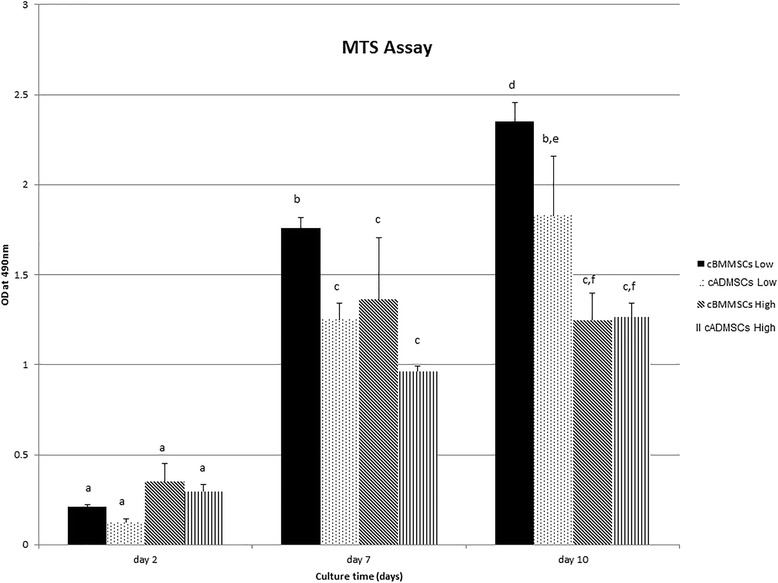
MTS assay. Comparison of proliferation of cBMMSCs and cADMSCs low and high passage over the period of 10 days. Significantly different values (P < 0.05) are indicated by superscript letters. Identical letters indicate no significance

MTS assay. Comparison of proliferation of cBMMSCs and cADMSCs low and high passage over the period of 10 days. Significantly different values (P < 0.05) are indicated by superscript letters. Identical letters indicate no significance