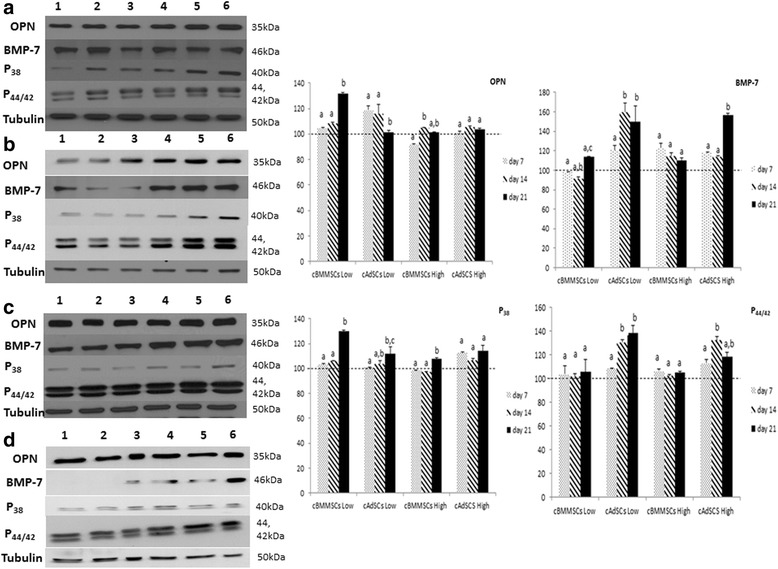
Fig. 7.

Immunoblot analyses. Western blots showing the expression of OPN, BMP-7, p38 and p44/42 in low and high passaged cBMMSCs and cADMSCs. Autoradiographs of undifferentiated (lanes 1, 2, 3) and differentiated (lanes 4, 5, 6) cells at three time points, d 7, 14, 21 are shown. Graphs represent the relative expression of each protein in the differentiated samples normalized with that in the undifferentiated samples. β tubulin was used as a housekeeping control. Dotted line indicates the protein expression in undifferentiated cells normalized to 100. Significantly different values (P < 0.05) represent the comparison between the three time points within a specific group. Identical letters indicate no significance
