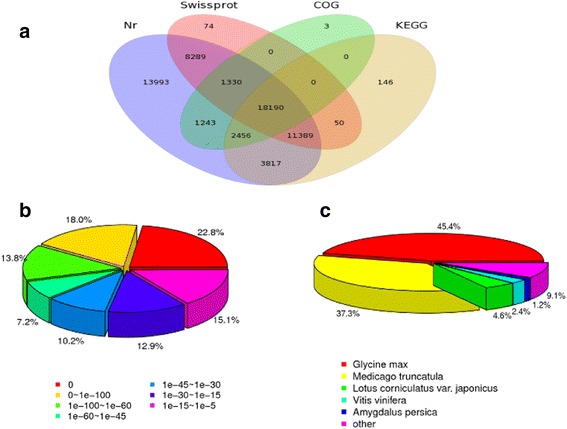
Fig. 2.

Distribution of the homology search of unigenes of against the database. a Venn diagram of a number of annotated unigenes by Blastx against protein databases. b E-value distribution of Blastx hits for each unigene against the NR database. c Species distribution of unigenes matching the top species using Blastx in the NR database
