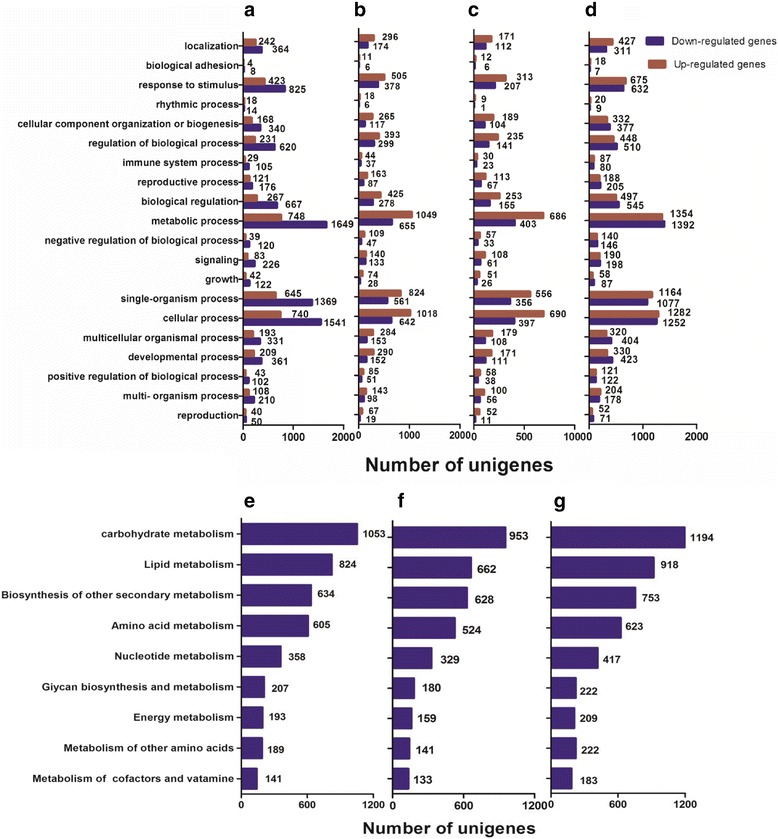
Fig. 5.

Plots of gene ontology (GO) terms from the biological process category of genes: a DE genes in total. b DE genes in mild stress (compare to the control). c DE genes in moderate stress (compare to the control). d DE genes in severe stress (compare to the control). e GO categories of a major metabolic process under mild stress (compare to the control). f GO categories of a major metabolic process under moderate stress (compare to control). g GO categories of a major metabolic process under severe stress (compare to control)
