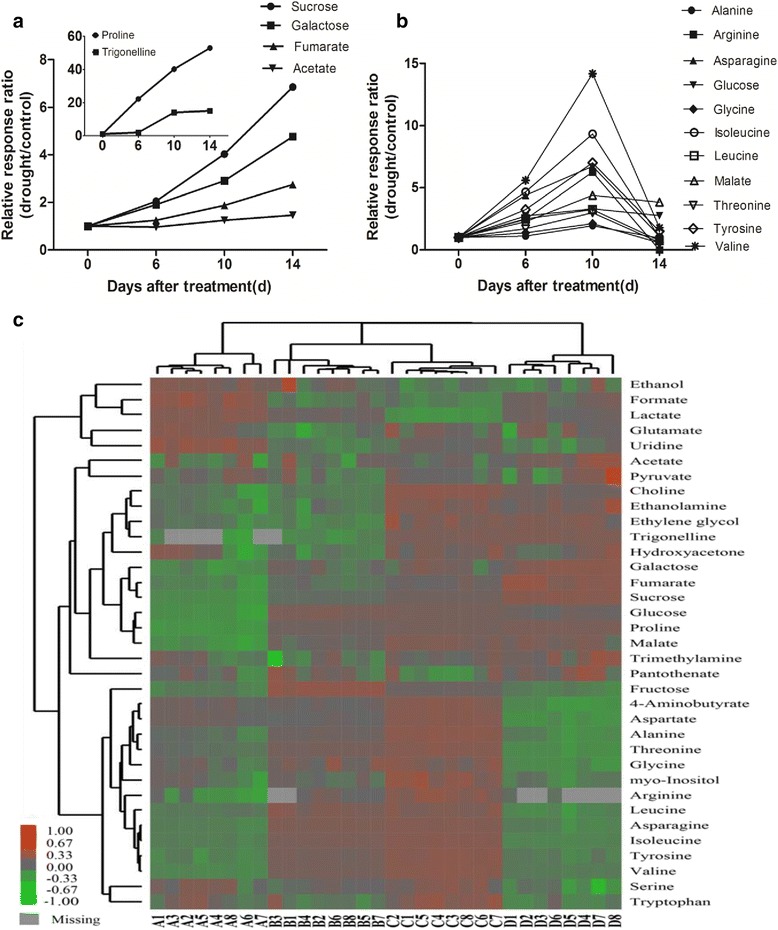
Fig. 6.

An overview of metabolic changes in A. mongolicus, which was exposed to drought stress. a, b Drought–induced metabolites concentration had relatively changed as compared to the control (0 day). c Differences in primary metabolite profiles during drought, heatmap color indicate the abundance of each metabolite in different stages of drought stress (A: control; B: water stress for 6 days; C: water stress for 10 days; D: water stress for 14 days)
