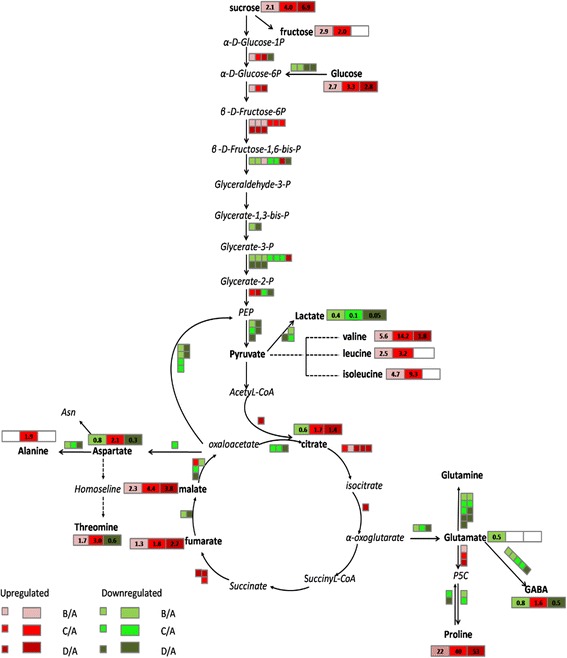
Fig. 8.

Pathway analysis related to A. mongolicus under progressive drought stress. The proposed metabolic pathways were based on literature and a web-based database of metabolic pathways. (A: control; B: water stress for 6 days; C: water stress for 10 days; D: water stress for 14 days). Metabolites, which were written in bold, were detected in this study. Metabolites in italic were not detected. Some metabolites have been omitted from this graph, because they were unaffected by drought stress. The small icons represent the genes, while the big icons represent the metabolites. Green indicates the down-regulated expression, while red indicates the up-regulated expression
