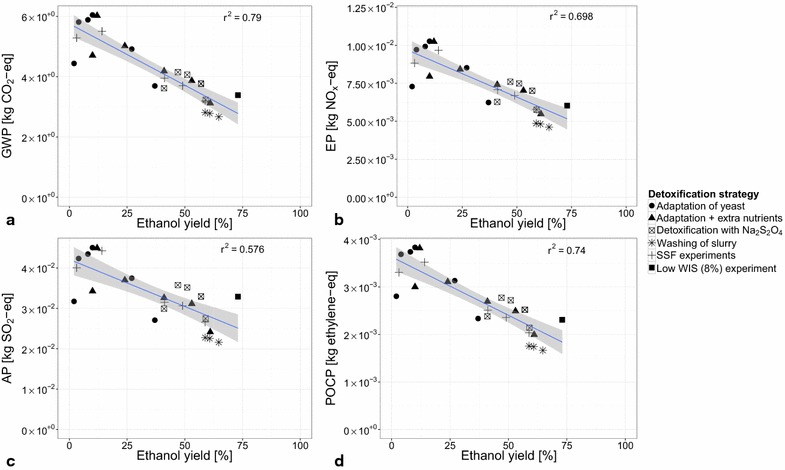
Fig. 3.

Correlation between the ethanol yield of the process configurations and their environmental impacts. The impact categories are: a global warming potential (GWP); b eutrophication potential (EP); c acidification potential (AP); d photochemical ozone creation potential (POCP). The linear trend line (in blue) and the 95 % confidence intervals (in gray) are given. The correlation coefficients () are mentioned in each graph
