
Fig. 1.
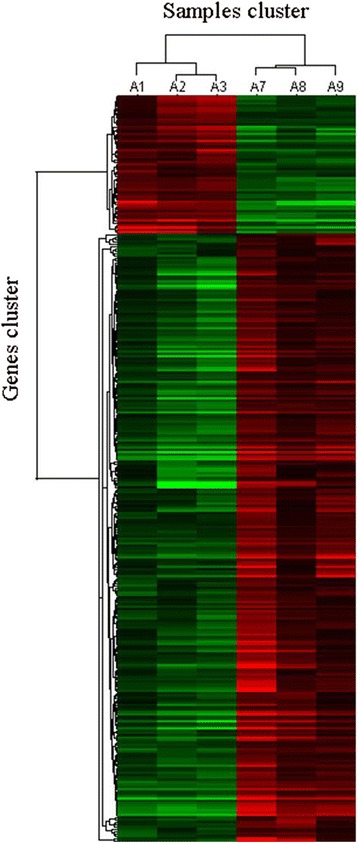
Hierarchical clustering of 319 differentially expressed genes in different P-treated conditions. A1, A2 and A3, three biological replicates of control groups (0.5 mmol/L P); A7, A8 and A9, three biological replicates of treatment groups (0.005 mmol/L P). Red and green indicate high and low expression levels, respectively