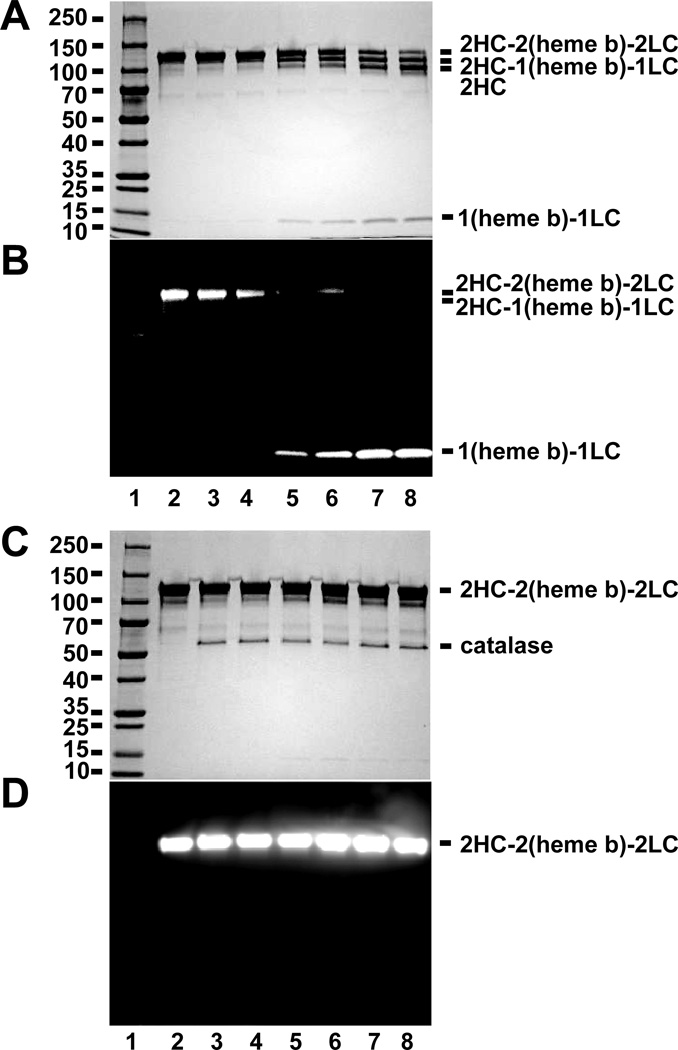
Figure 3. Cleavage of MPO by BAH is dependent on H2O2.
A-B, Protein-stained image (A & C) and luminescence imaging (B & D) for a molecular weight marker (lane 1), MPO alone (1.2 µM, lane 2), and reactions of MPO (1.2 µM) with increasing concentrations of BAH, namely 0.025 mM (lane 3), 0.25 mM (lane 4), 2.5 mM (lane 5), 5 mM (lane 6), 12.5 mM (lane 7) and 25 mM (lane 8) for 10 min. C-D, Similar reactions where BAH and MPO were separately incubated with catalase (20 units) for 1hr prior to mixing. Experiments conducted as described under “Experimental Procedures.”

