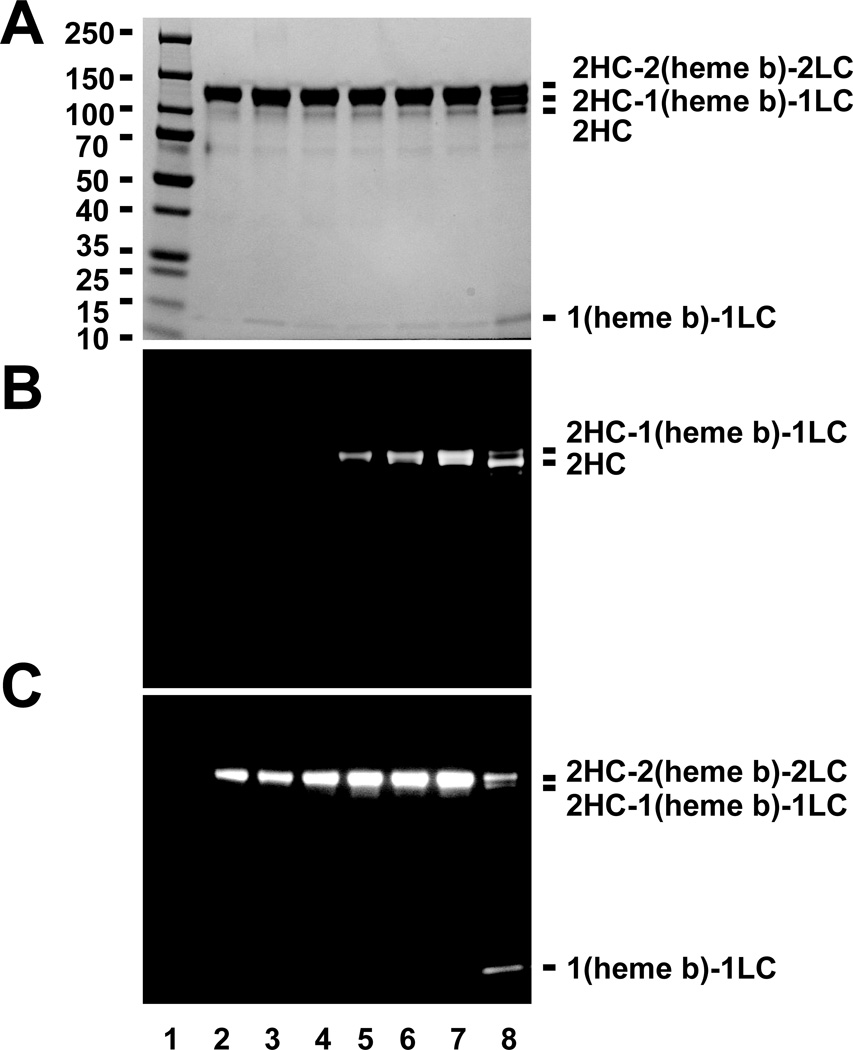
Figure 5. Tracking Cy5 modification following cleavage of the (heme b)-LC from HC of MPO.
Protein-stained bands (A), fluorescence (B), luminescence imaging (C) for a molecular weight marker (lane 1), MPO alone (1.2 µM, lane 2), and reactions of MPO (1.2 µM) with increasing concentrations of Cy5-hydrazide, namely 0.05 mM (lane 3), 0.1 mM (lane 4), 0.5 mM (lane 5), 1 mM (lane 6), 2 mM (lane 7) and 5 mM (lane 8) in the presence of 20 µm H2O2 for 10 min. Additional details related to this experiment can be found in “Experimental Procedures.”

