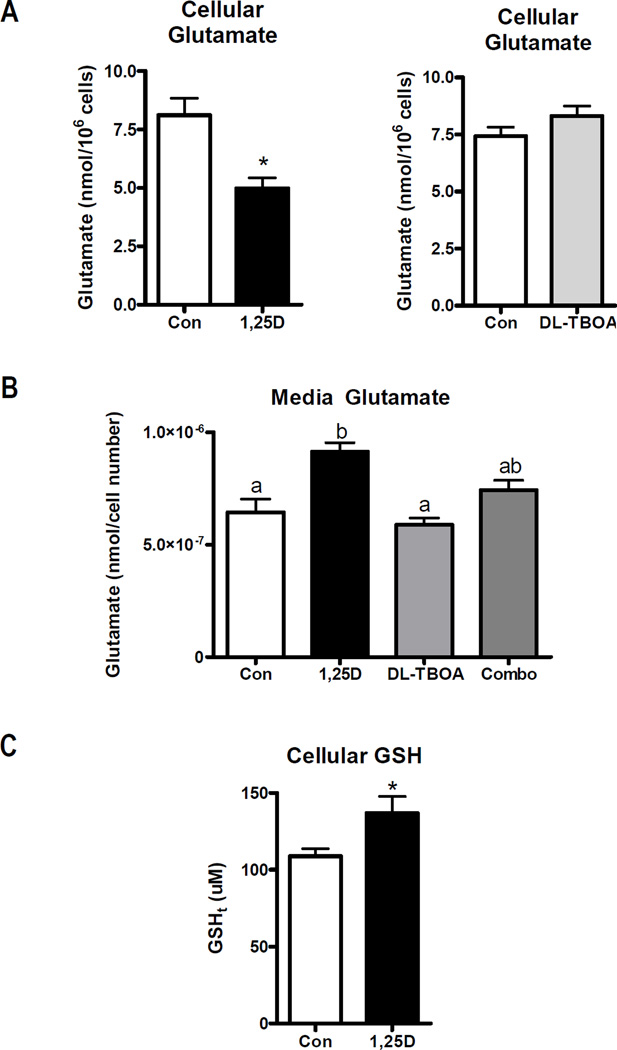
Figure 6. Effect of 1,25D on glutamate and GSH content.
A, Cellular glutamate was measured in lysates from hTERT-HME1 cells treated with vehicle, 100 nM 1,25D or 200 uM DL-TBOA for 48 h. Cell numbers were significantly altered after 48 h of 1,25D treatment (Con, 6.1±0.4 × 10⁶ cells; 1,25D, 4.9±0.5 × 10⁶ cells; p<0.05), therefore data was normalized to 106 cells. B, Media collected from cells treated with 100 nM 1,25D ± 200 uM DL-TBOA for 48 h was analyzed for glutamate content which was expressed relative to culture density evaluated by crystal violet staining of the adherent cells. For both A and B, glutamate was determined with a kinetic colorimetric assay kit as described in methods. C, GSH content was measured in hTERT-HME1 cells treated with 100 nM 1,25D or ethanol vehicle (Con) for 48 h. 106 cells were deproteinated and analyzed with the Bioxytech GSH/GSSG-412 nm assay. For all graphs, bars represent the mean ± SD of triplicates. In A and C, significance was evaluated by one-tailed, unpaired student t-test; * p<0.05. In B, significance was evaluated by one-way ANOVA and Tukey post-test and is indicated by letters above the bars: those bars annotated with different letters are significantly different (p<0.05).

