Figure 5.
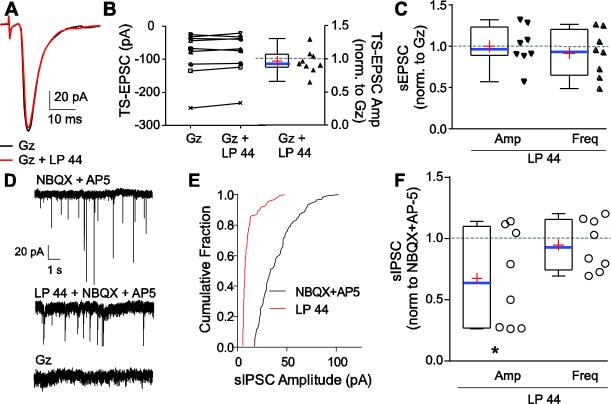
GABAARs modulate 5-HT7R influence on IPSCs. A. Example of representative 0.5 Hz TS-EPSCs during gabazine (Gz) alone and during Gz and LP 44 (black, Gz alone; red, Gz + LP 44). Example is the average of 30 traces. Note the reduced LP 44 response during GABAA receptor blockade. B. Quantitative TS-EPSC amplitude evoked at 0.5 Hz during GABAAR blockade and to addition of 10 μM LP 44. Raw values are presented on the left axis whereas the change in TS-EPSCs in LP 44 in Gz, normalized to Gz alone, is presented on the right axis. Note that addition of LP 44 in Gz did not change TS-EPSC amplitude. C. Change in sEPSC amplitude and frequency of individual responses during 10 μM LP 44 in Gz, normalized to Gz alone (denoted as “1”, dashed line). D. Example of control sIPSCs (top) and their reduction in amplitude with 5-HT7R activation (LP 44, 10 μM, middle) in the presence of NBQX and AP-5. Addition of Gz (bottom) eliminated sIPSCs confirming currents were mediated by GABAAR. E. Cumulative fraction of amplitude events for recording from D. Note that amplitude is reduced with LP 44 in the presence of NBQX and AP-5. F. Normalized group data showing changes in sIPSC amplitude (left) and frequency (right) to LP 44 respective to baseline (NBQX + AP5). Note the significant decrease in sIPSC amplitude. (n=8, * p < 0.05, paired t-test).

