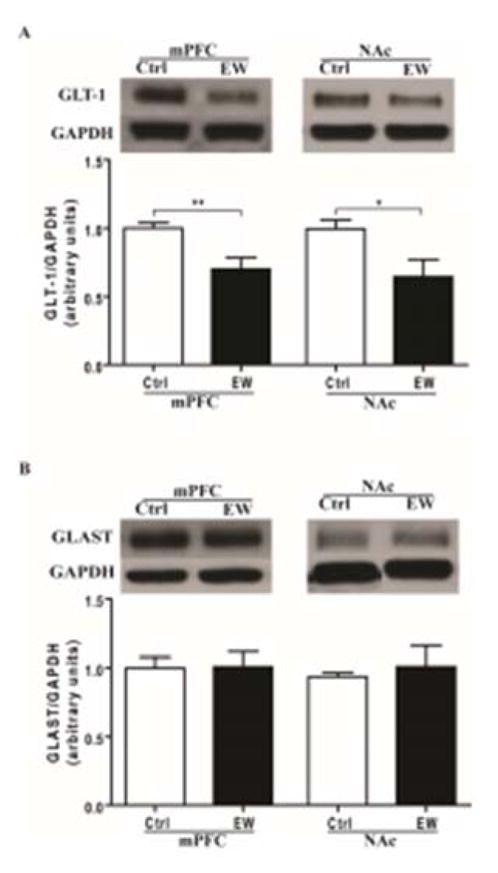
Figure 2.

Effects of EW on expression of GLT-1 and GLAST in mPFC and NAc. A) GLT-1 expression was significantly downregulated in the EW group compared to control group in both mPFC (**, p<0.01) and NAc (*, p<0.05). B) GLAST expression was unchanged in the EW group compared to control group in both mPFC and NAc. All data are expressed as mean ± SEM. n= 7–8 rats/group. Ctrl, control; EW, ethanol-withdrawal.
