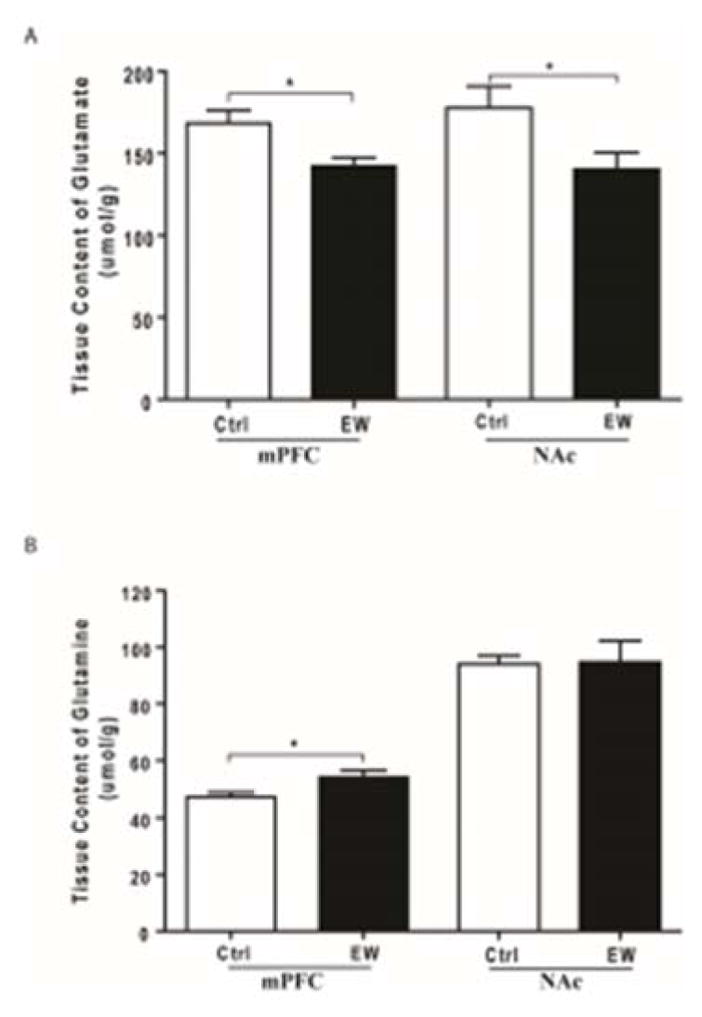
Figure 4.

Effects of EW on tissue content of glutamate (A) and glutamine (B) in both mPFC and NAc. A) Tissue content of glutamate was significantly lower in both mPFC and NAc of the EW group compared to control group (*, p<0.05). B) Tissue content of glutamine was significantly higher in mPFC of the EW group compared to control group (*, p<0.05). Tissue content of glutamine was unchanged in NAc of the EW group compared to control group. All data are expressed as mean ± SEM. All data are expressed as mean ± SEM. n=6–8 rats/group. Ctrl, control; EW, ethanol-withdrawal.
