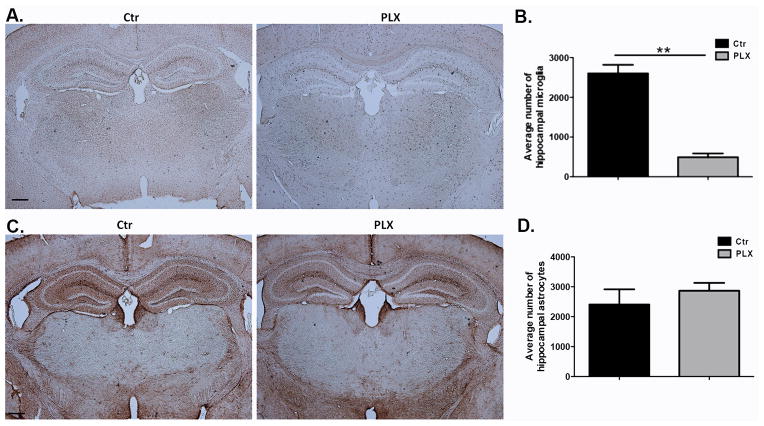
Figure 7. Astrocyte numbers between control and PLX-3397-treated animals are similar at a time point at which differences in Barnes maze performance were observed.
(A–B) Mice were fed with PLX3397 or control chow for 10 days. Brain sections were stained for Iba-1 and hippocampal microglia were quantified in three sections per biological replicate. n=3 per group. (C–D) Mice were fed with PLX3397 or control chow for 10 days. Brain sections were stained for GFAP and hippocampal astrocytes were quantified in three sections per biological replicate. n=3 per group. Data are shown as mean ± SEM. ** p<0.01. Scale = 100μm.

