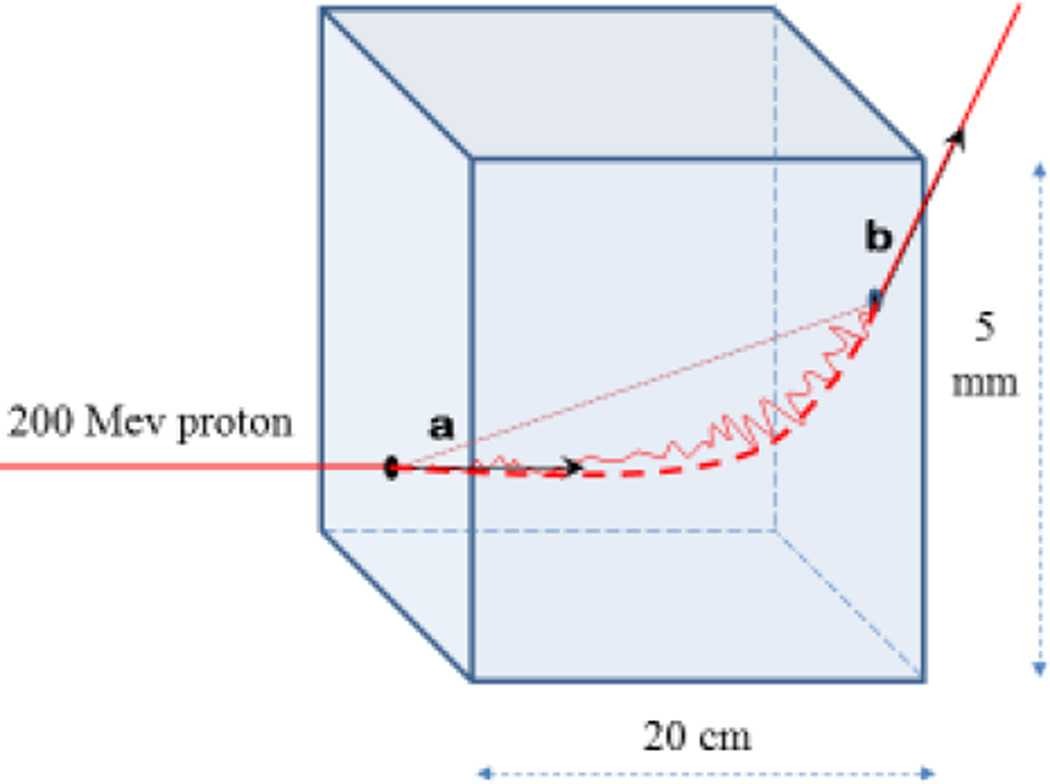
Fig. 2.
Illustration of the MLP concept (not to scale) The solid line represents the trajectory of a proton undergoing (exaggerated) multiple Coulomb scattering in a water slab. Vectors a and b (generally non-coplanar) represent proton entry and exit directions, respectively, necessary to evaluate the MLP. The dashed line shows the MLP and the dotted line corresponds to a straight-line approximation used in regular CT reconstruction.

