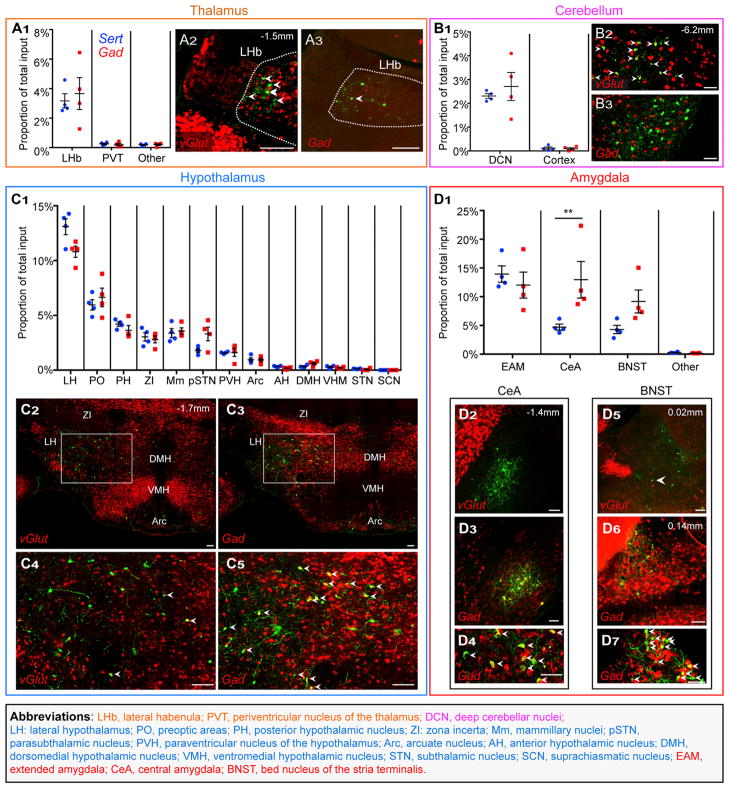
Figure 3. Quantitative Analysis of Subcortical Input Distribution.
Inputs to DR serotonin or GABA neurons from subregions of the groups shown in Figure 2D. As in Figure 2, dots represent four individual Sert-cre (blue) and Gad2-cre (red) tracing experiments and are shown as the proportion of the total cells counted in an experimental brain located in a given subregion. Accompanying photomicrographs show glutamatergic or GABAergic projections from subregions of interest. Green, rabies-GFP; red, ISH using a vGlut1 and/or vGlut2 probe or a Gad1+2 probe mix. All arrowheads point to double-labeled cells. Values in the upper right indicate approximate distance from bregma for each set of images.
(A) (A1) Proportion of total inputs from thalamic subregions. Inputs from the thalamus are almost entirely from the lateral habenula (LHb) and glutamatergic (A2), though we observe sparse LHb GABAergic presynaptic neurons as well (A3).
(B) (B1) Proportion of total inputs from the cerebellum. Inputs from the cerebellum are almost entirely from the deep cerebellar nuclei (DCN) and are glutamatergic (B2) and not GABAergic (B3).
(C) (C1) Proportion of total inputs from subregions of the hypothalamus. The lateral hypothalamus (LH) makes up the majority of hypothalamic input, though many regions send considerable projections to the DR. The LH sends both glutamatergic and GABAergic projections ([C2]–[C5]).
(D) (D1) Proportion of total inputs from subregions of the amygdala. The central amygdala (CeA) makes up a larger proportion of total input to DR GABA compared to serotonin neurons (Bonferroni correction against the 33 subregion comparisons). The central amygdala sends GABAergic and not glutamatergic input ([D2]–[D4]). The dorsal BNST sends GABAergic input ([D6] and [D7]), and we have seen sparse vGlut2+ projections from other subregions (D5).
Scale, 100 μm. Abbreviations color code are as follows: subregions of the thalamus (orange), cerebellum (magenta), hypothalamus (blue), and amygdala (red). Table S1 contains cell counts for each subregion, including those not shown here, and qualitative information on subregions not counted.
Abbreviations: LHb, lateral habenula; PVT, periventricular nucleus of the thalamus; DCN, deep cerebellar nuclei; LH: lateral hypothalamus; PO, preoptic areas; PH, posterior hypothalamic nucleus; ZI: zona incerta; Mm, mammillary nuclei; pSTN, parasubthalamic nucleus; PVH, paraventricular nucleus of the hypothalamus; Arc, arcuate nucleus; AH, anterior hypothalamic nucleus; DMH, dorsomedial hypothalamic nucleus; VMH, ventromedial hypothalamic nucleus; STN, subthalamic nucleus; SCN, suprachiasmatic nucleus; EAM, extended amygdala; CeA, central amygdala; BNST, bed nucleus of the stria terminalis.

