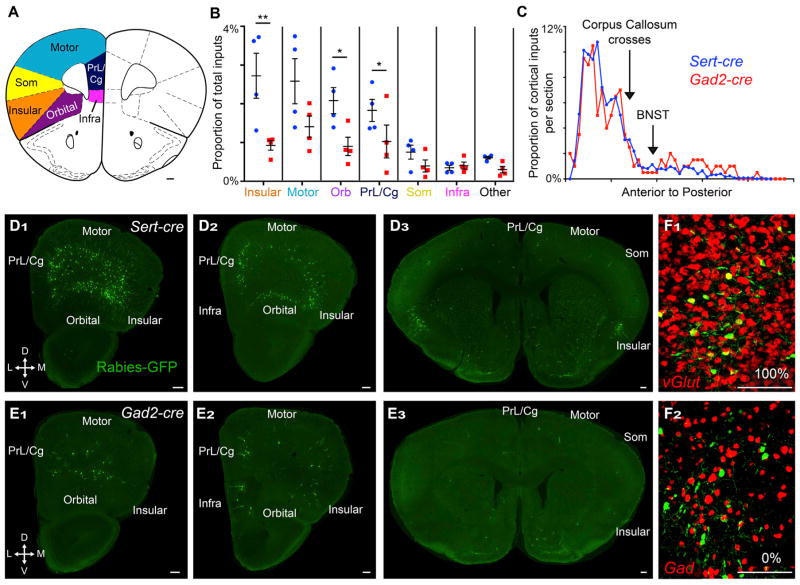
Figure 5. Quantitative Analysis of Cortical Input Distribution.
(A) Schematic showing the location of cortical subregions quantified in (B) at one of the many coronal planes quantified.
(B) Inputs to DR serotonin (blue) or GABA (red) neurons from subregions of the anterior cortex. Serotonin neurons receive a higher proportion of their total input from insular, orbital (orb), and prelimbic/cingulate (PrL/Cg) cortices. “Other” includes all other neocortical regions.
(C) Neocortex input neurons per coronal section from anterior (left) to posterior in a representative Sert-cre (blue) and Gad2-cre (red) brain. The first crossing of the corpus callosum and the anterior border of the BNST indicated on graph.
(D and E) Coronal sections of a Sert-cre (D) and a Gad2-cre (E) brain with the locations of cortical subregions indicated.
(F) Cortical projections are all glutamatergic (F1) and not GABAergic (F2).
Scale, 200 μm. Som, somatosensory cortex; Infra, infralimbic cortex.

